You’re viewing an abridged version. Open on desktop for the full case study.
Advisors opened RISR to close deals, then never came back. Here’s how I redesigned around their actual workflow and doubled revenue.

I redesigned RISR from a one-time valuation calculator into a live conversation tool that advisors bring into client meetings every month. In three months post-launch: revenue doubled to $1M ARR, 1,000+ cases generated at 95% completion, and advisor engagement increased 7x.
I redesigned RISR from a one-time valuation calculator into a live conversation tool that advisors bring into client meetings every month.
2x revenue
We doubled revenue to $1M ARR in 3 months post-launch.
1,000+ cases
Platform generated over 1,000 cases at a 95% completion rate.
7x engagement
Advisors went from 1–2 annual touchpoints to 5–10 per year.
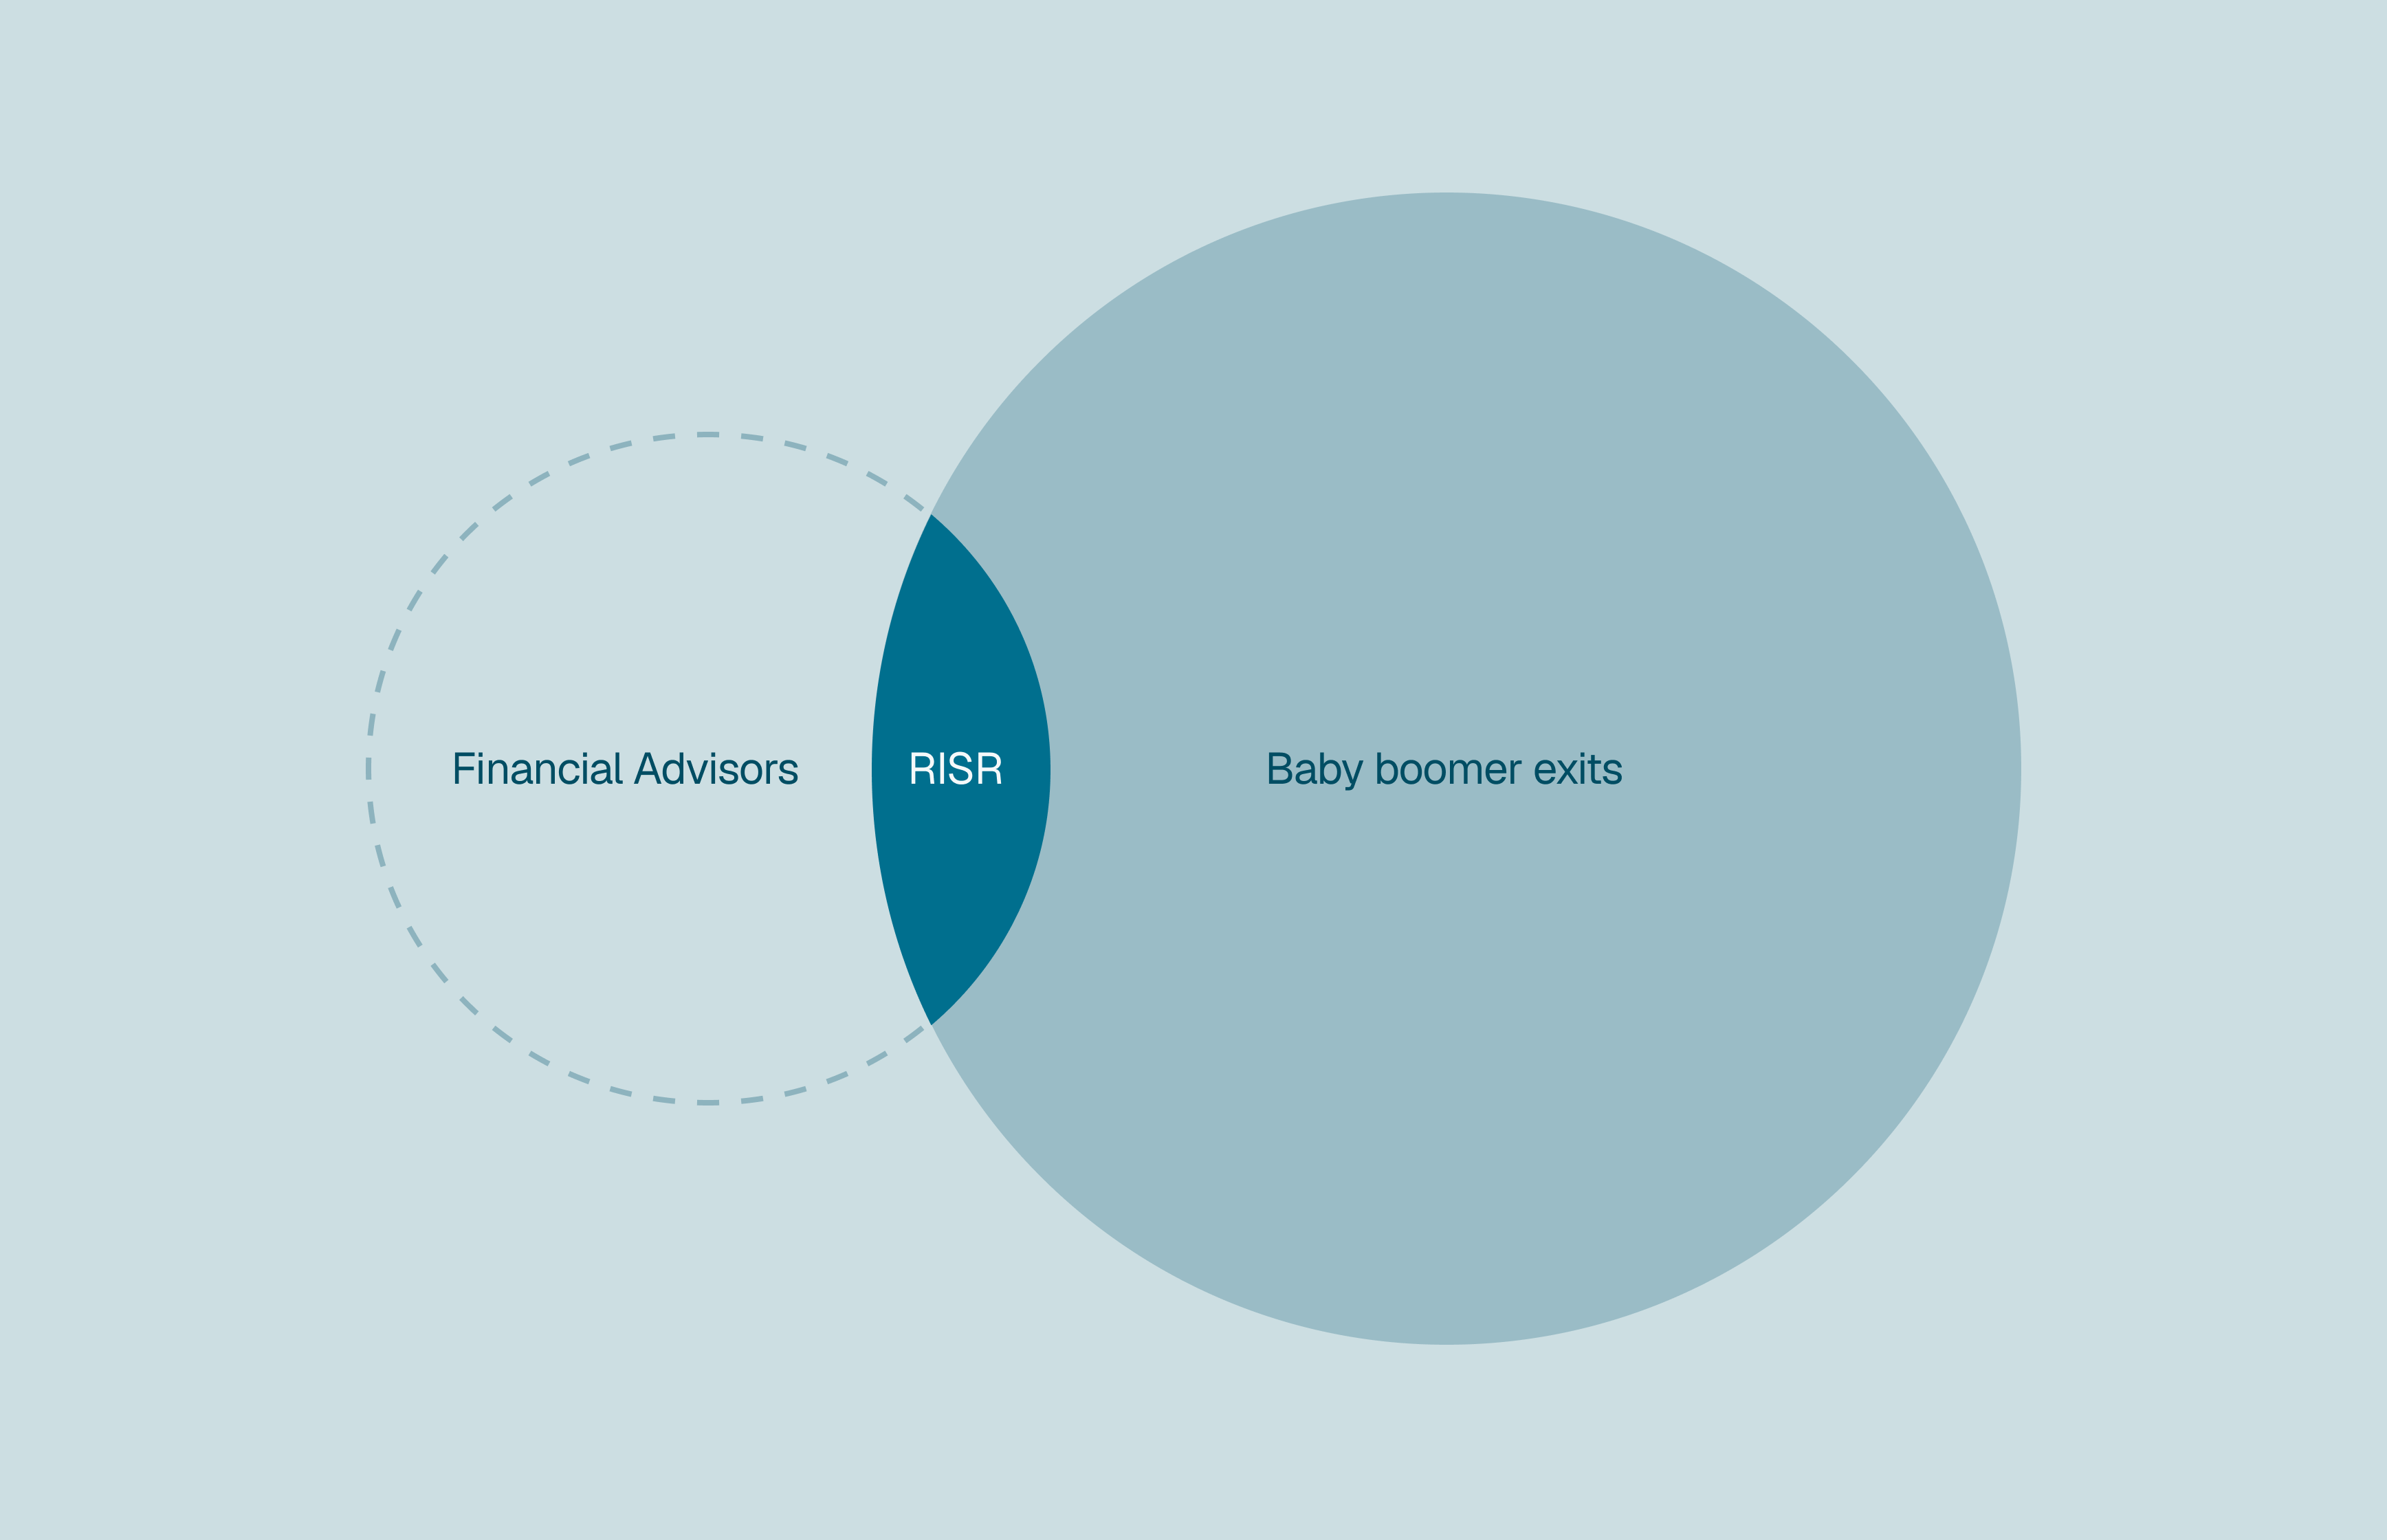
The biggest wealth transfer in history
RISR is a financial planning platform helping advisors guide business owners through the largest wealth transfer in history: baby boomers exiting their businesses over the next two decades.
RISR helps financial advisors guide business owners through the largest wealth transfer in history.
market opportunity
Most advisors don’t know how to engage business owners before they have liquid assets to manage. RISR gives them the playbook to turn one-time conversations into decades-long relationships.
RISR gives advisors the playbook to turn one-time conversations into decade-long relationships.
Our big bet: “Let the numbers dance”
After V1 launched, case volume was low. The gut reaction was to look at usability. We went and talked to advisors instead.
After V1 launched with low case volume, we talked to advisors instead of assuming a usability problem.
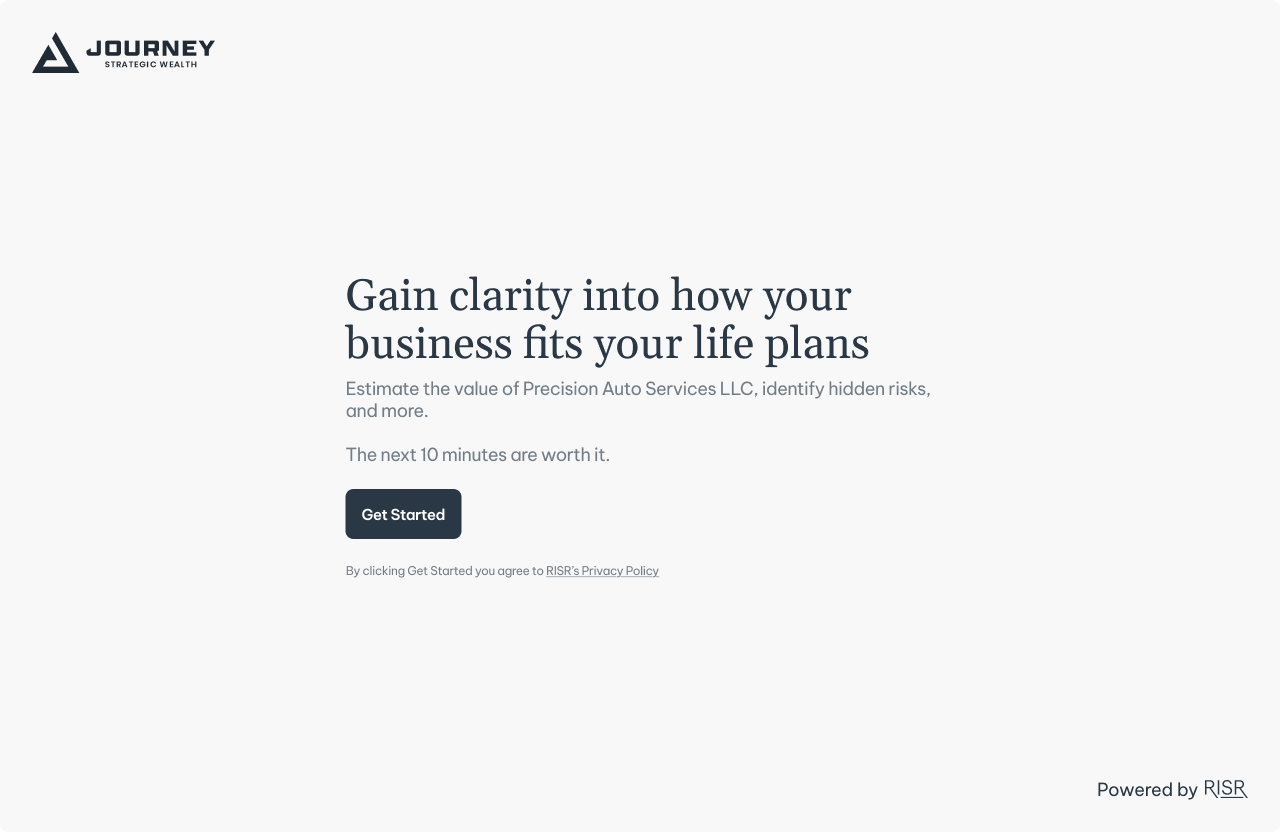
Step 1: Advisors collect data from their clients via a unique survey link
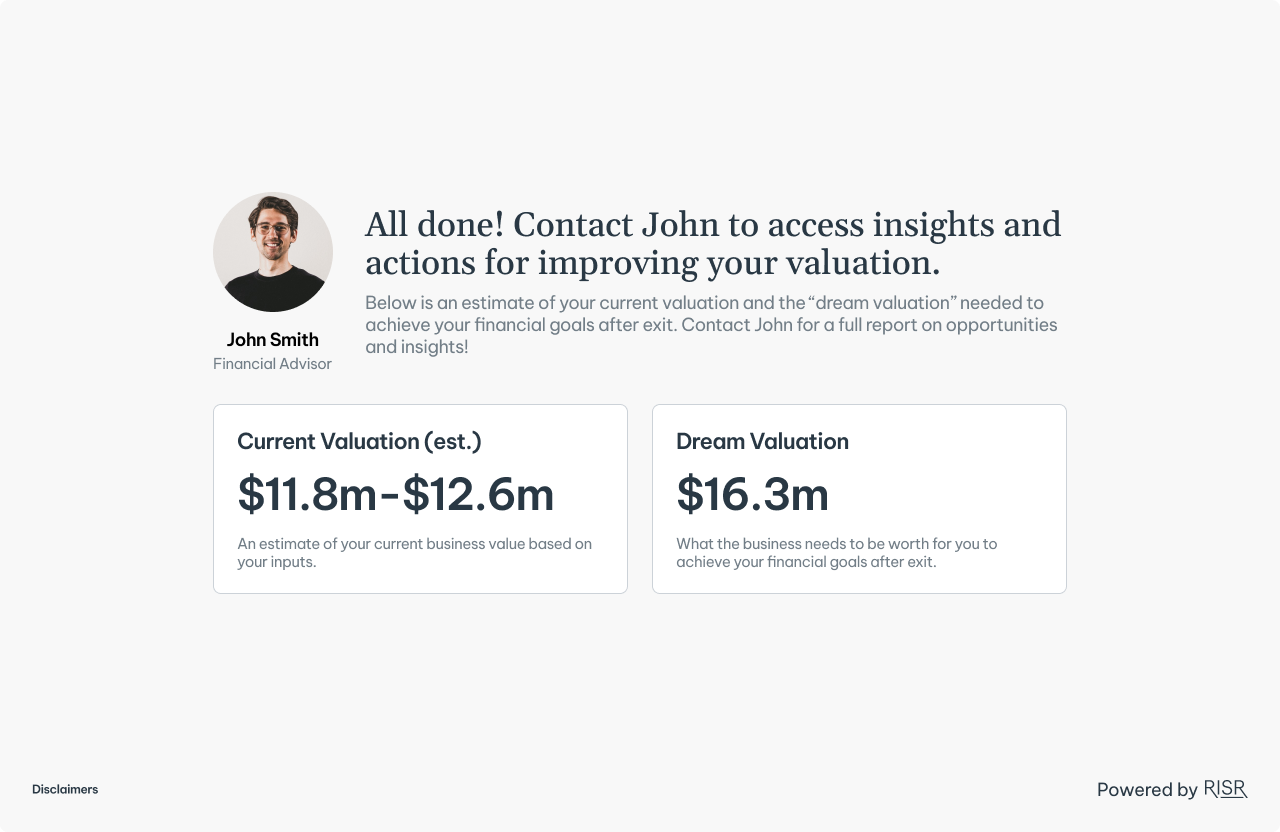
Step 2: Upon completion, data is sent for advisor review and clients are prompted to discuss with their advisor
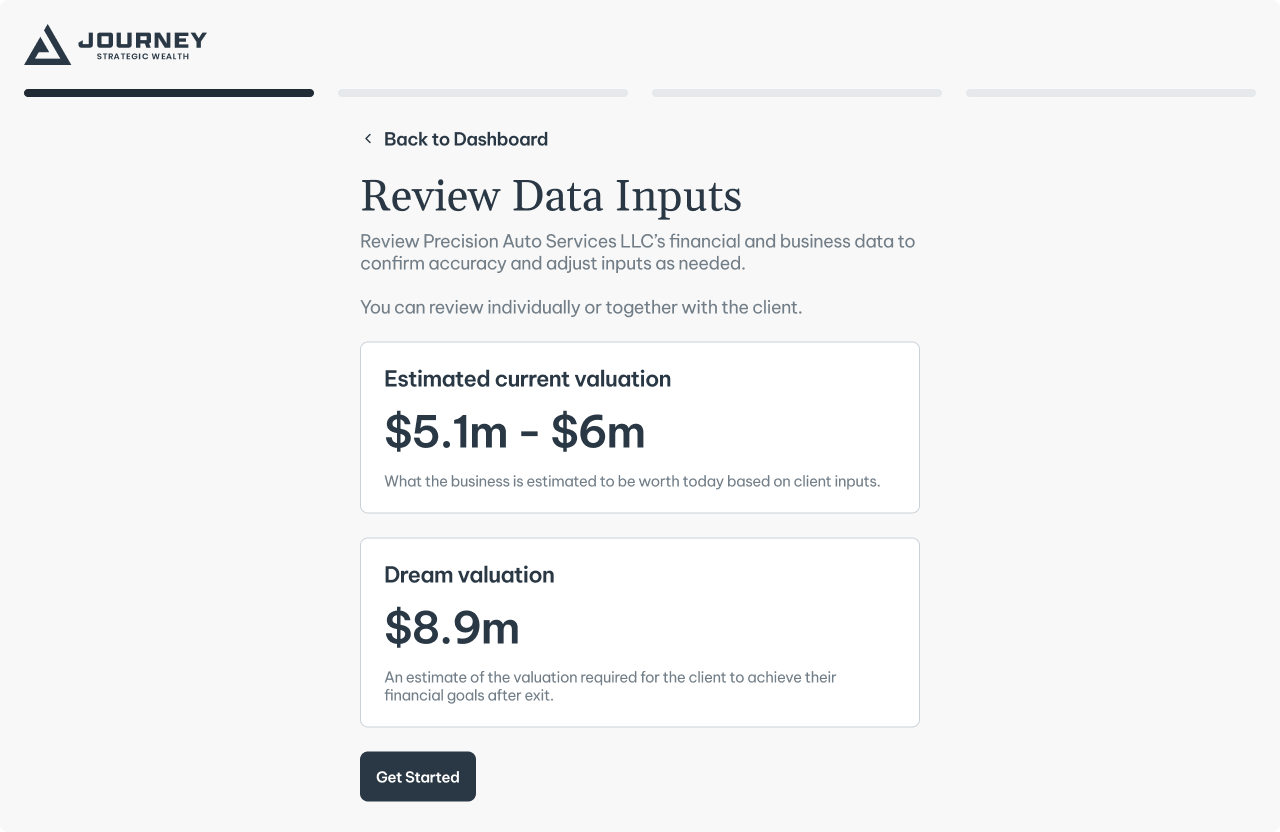
Step 3: Advisors review data to check for gaps, inconsistencies, or clerical errors
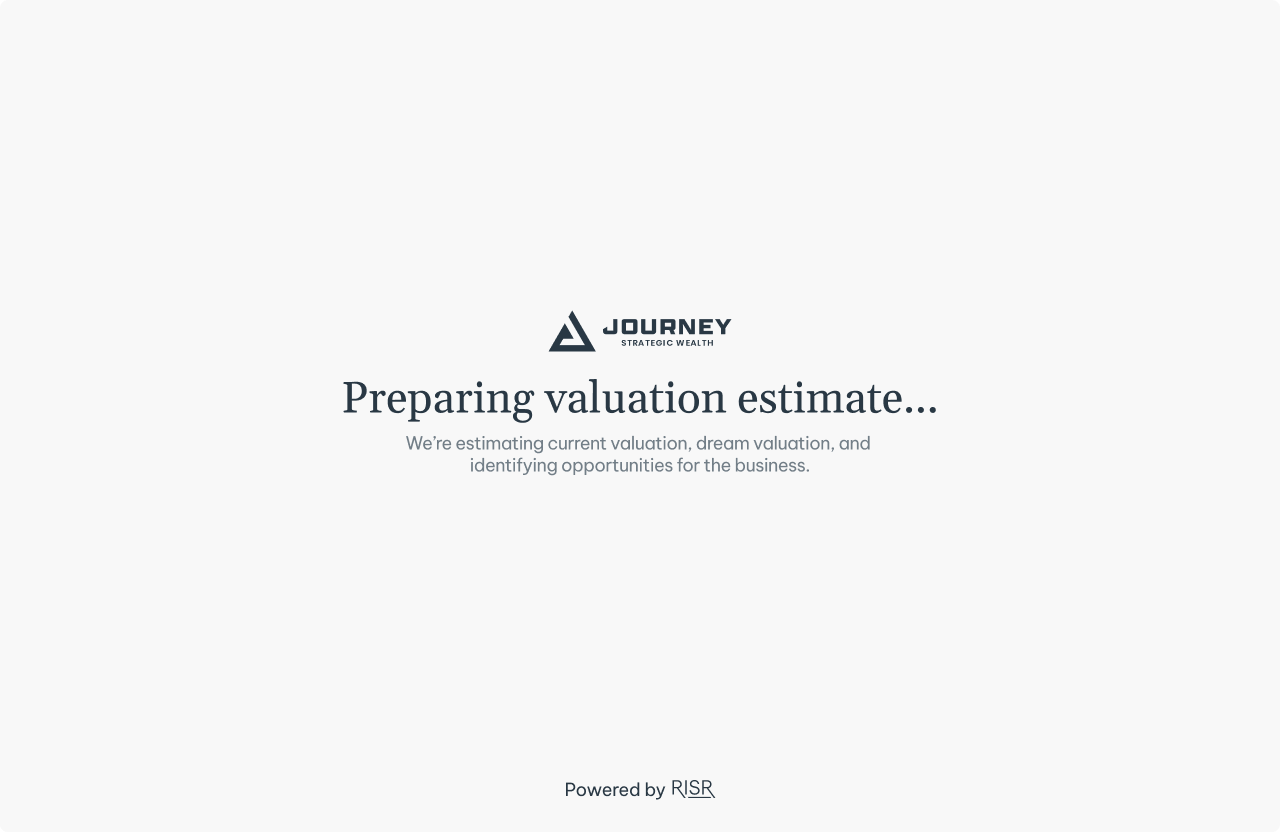
Step 4: Advisors trigger the valuation generator
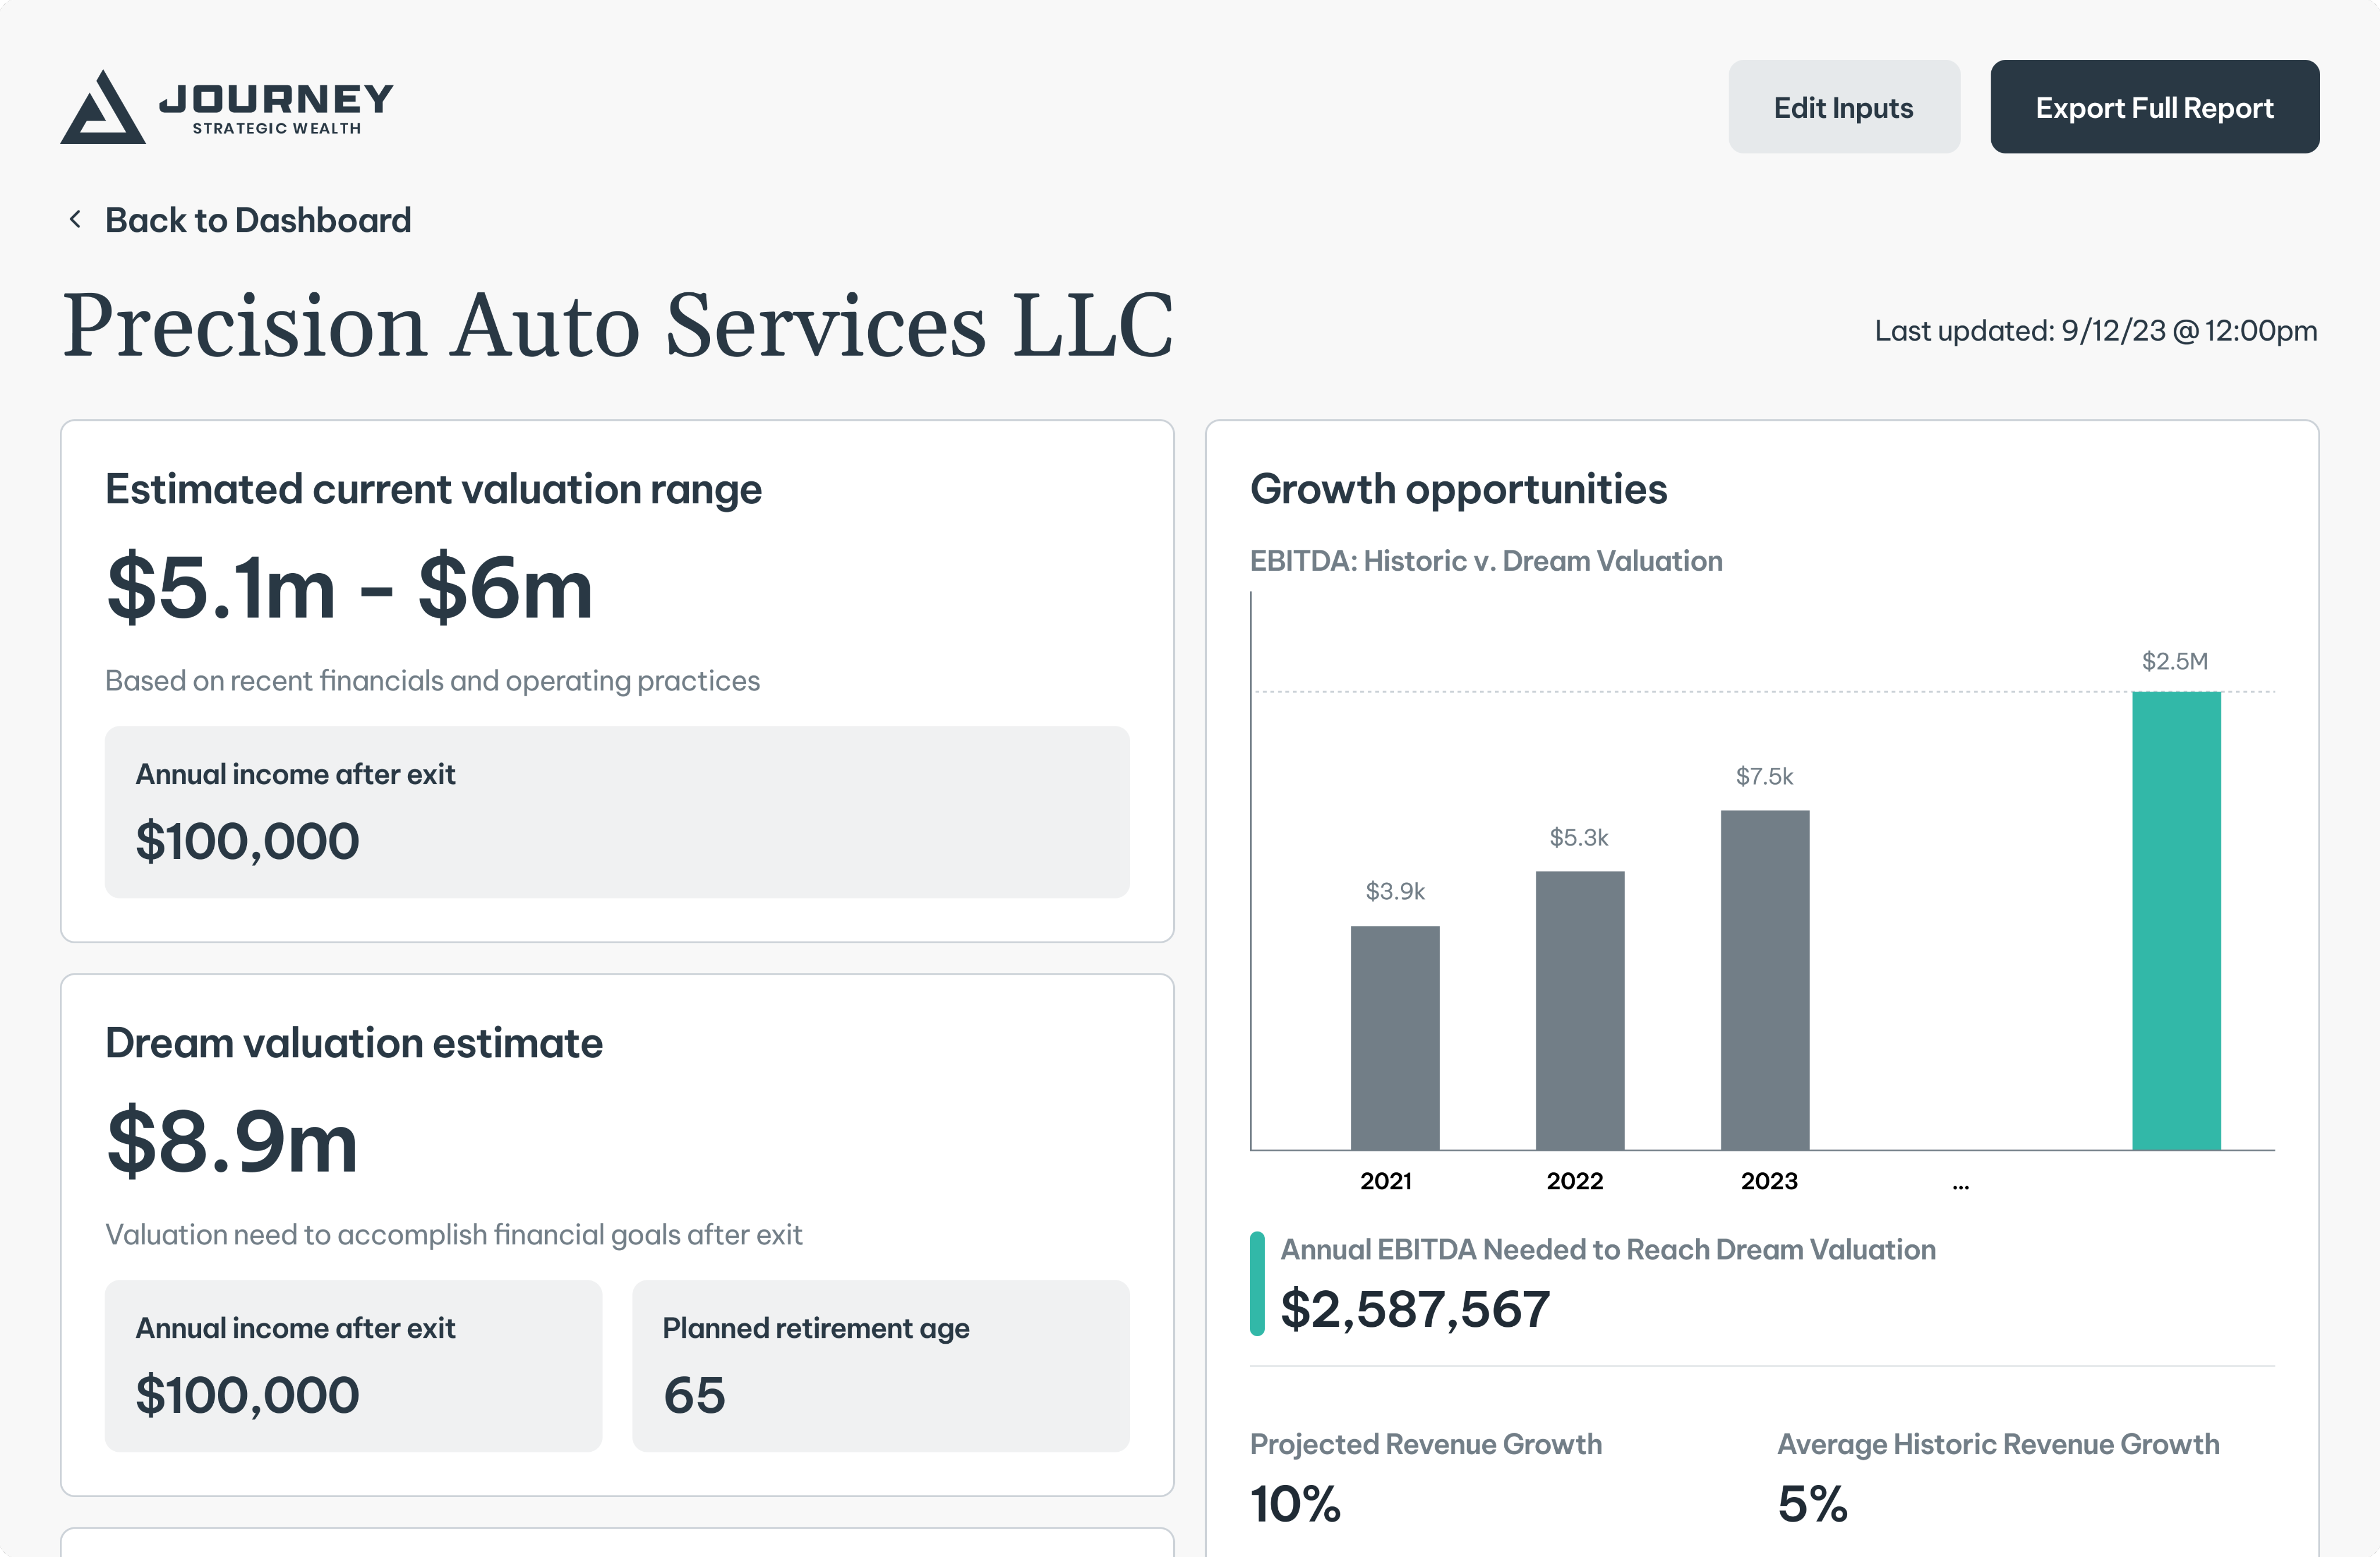
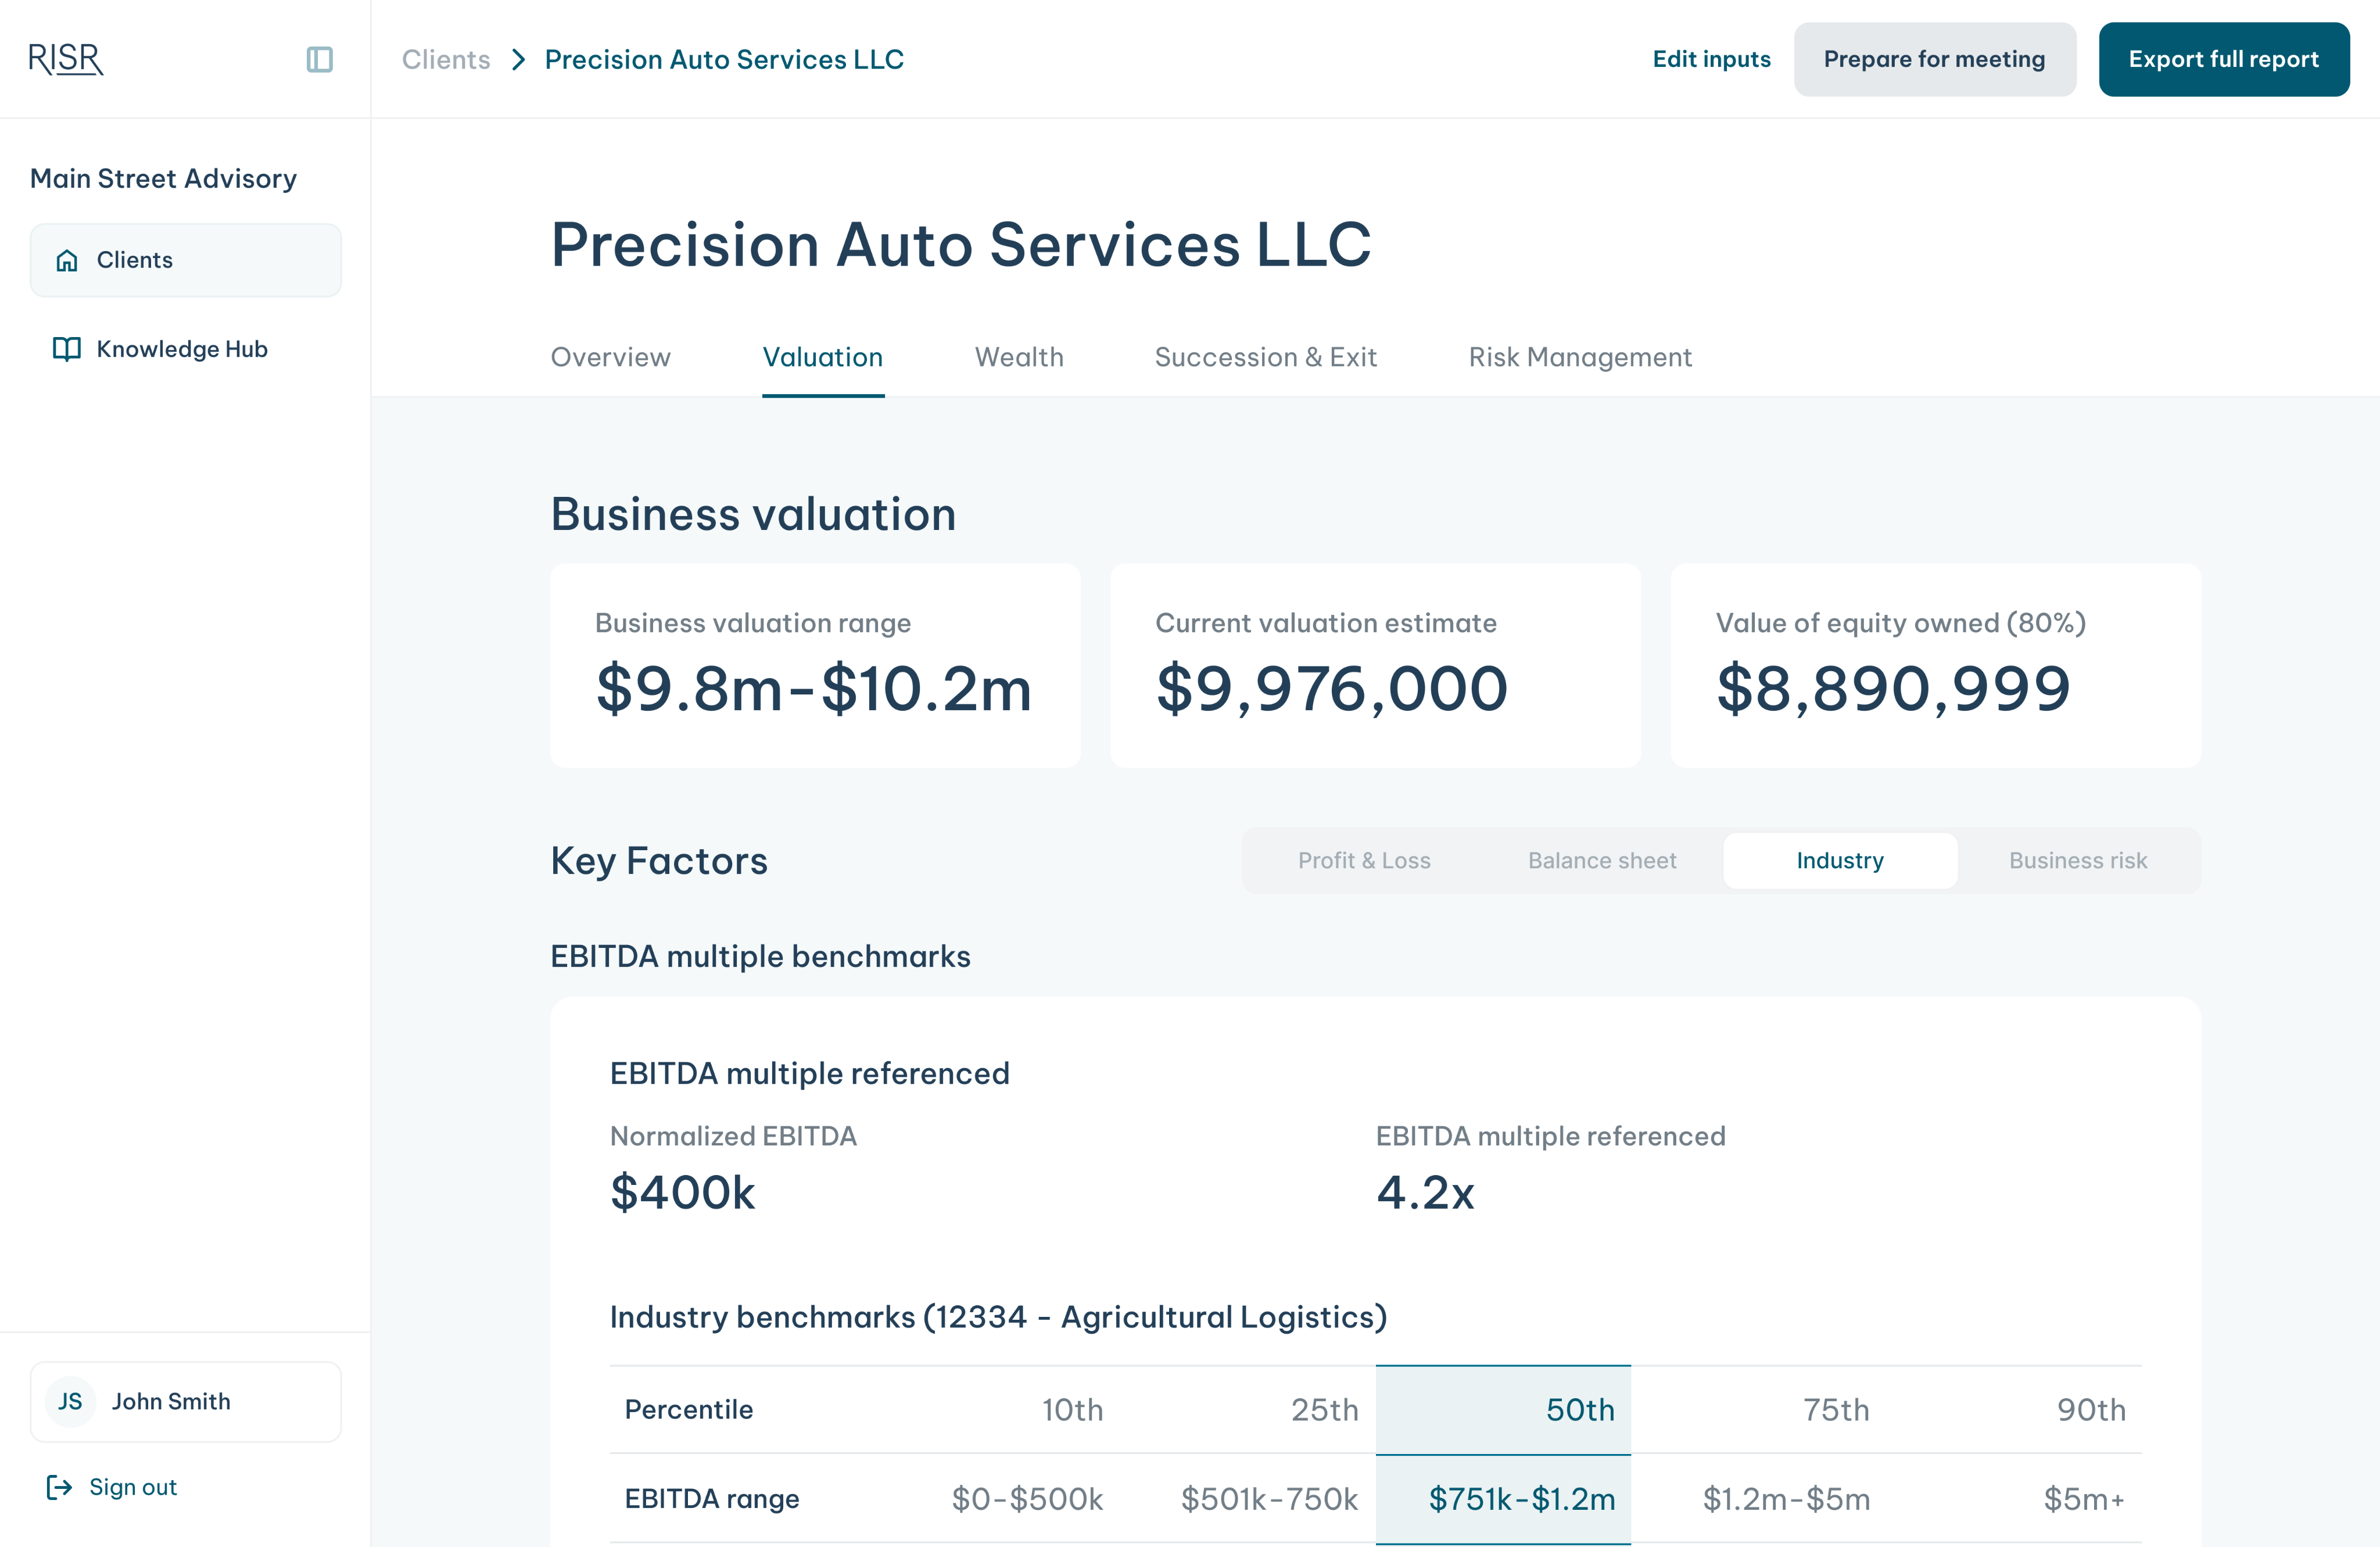
Step 5: Advisors are presented with a static dashboard that’s a simple preview of the full custom PDF
what advisors told us
What I found wasn’t a design polish problem. Advisors only opened RISR when they needed to close a specific deal: generate a PDF, deliver it, done. The platform had no place in their ongoing practice because it was built around a single moment: the close.
Everything else, the questions clients asked live, the scenarios they wanted to explore, the conversations that built trust over years happened somewhere else, in scattered notes, software, and messages.
Everything else, the questions clients asked live, the scenarios they wanted to explore, the conversations that built trust over years happened somewhere else, in scattered notes, software, and messages.
The reframe
The platform wasn’t failing because it wasn't usable. It was failing because it didn’t fit how advisors actually work.
During one of those advisor conversations, someone said: “I need to let the numbers dance.”
One advisor phrase — “let the numbers dance” — unlocked the entire redesign direction.
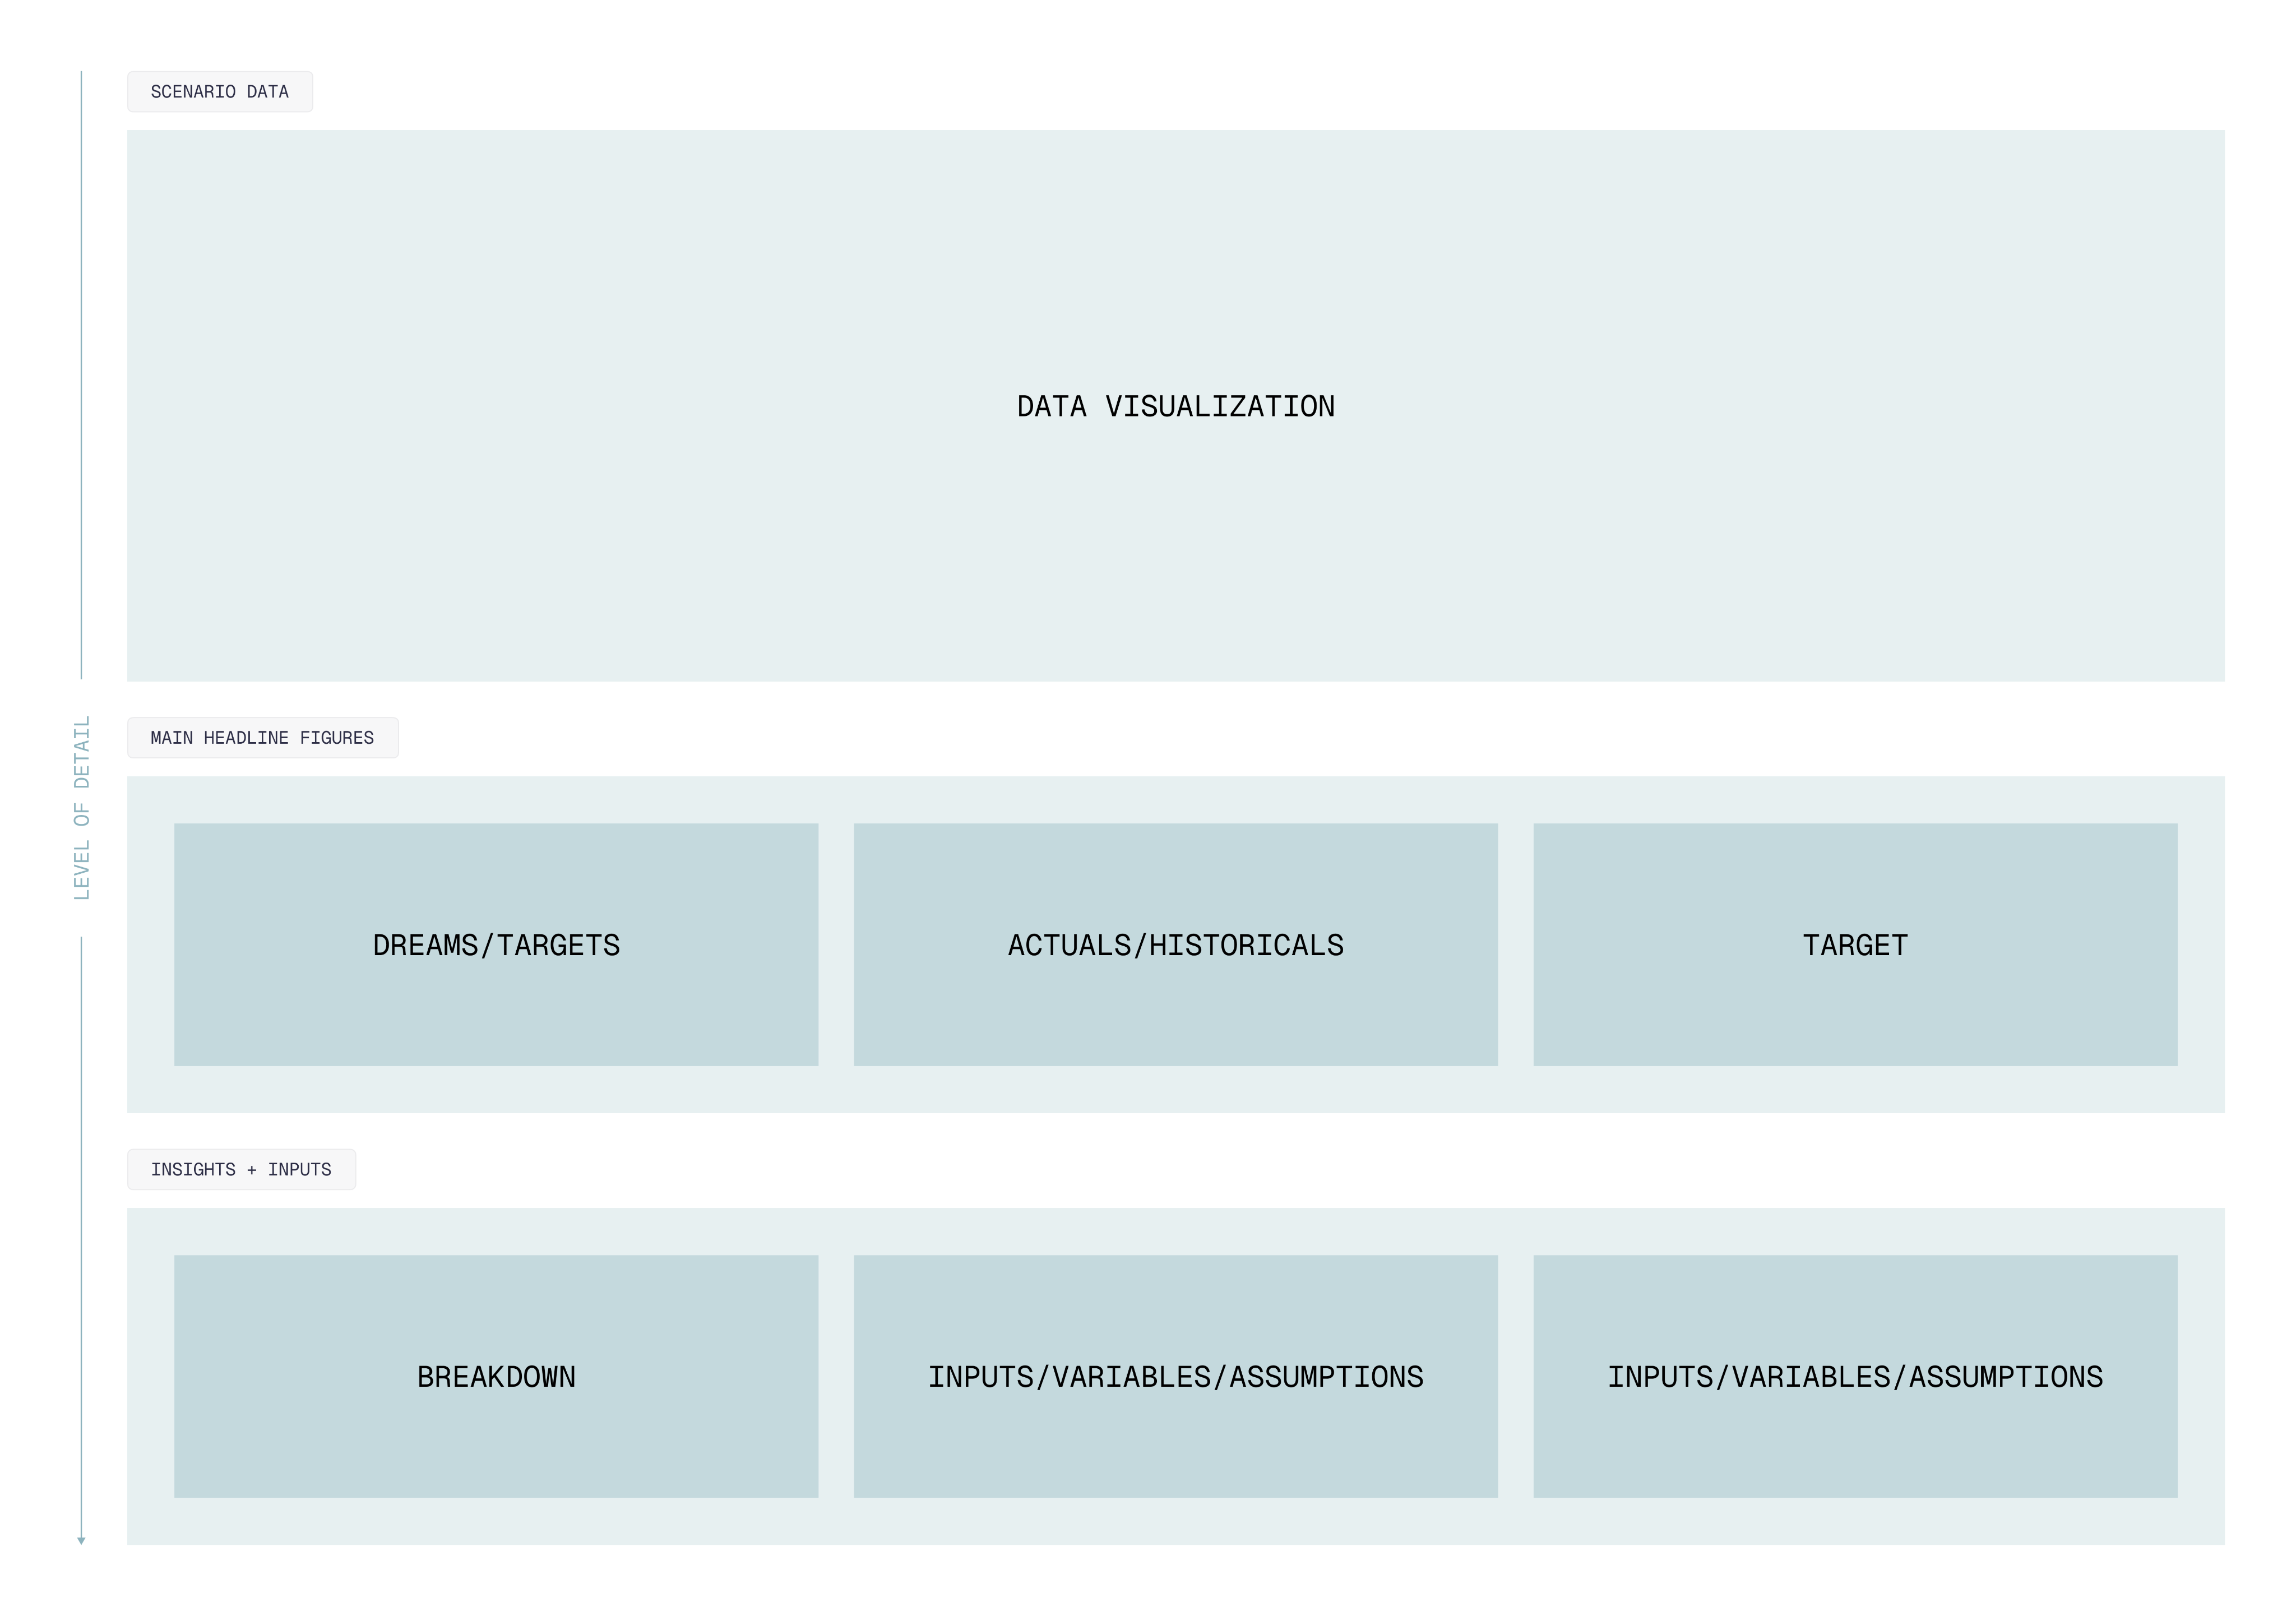
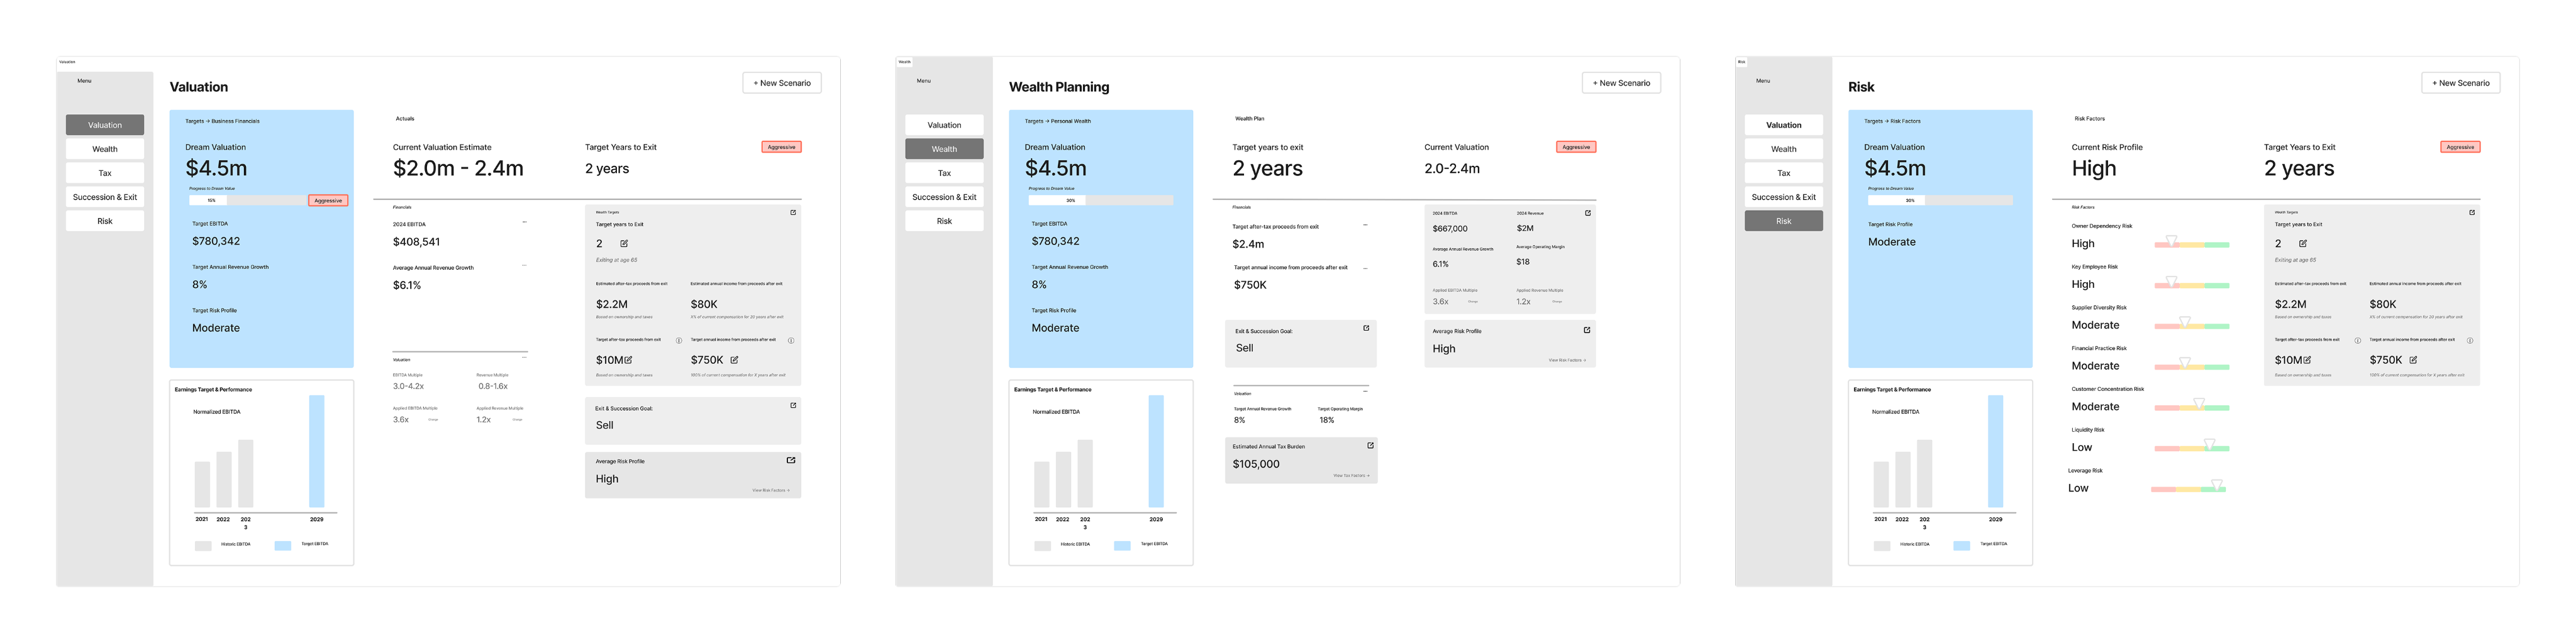
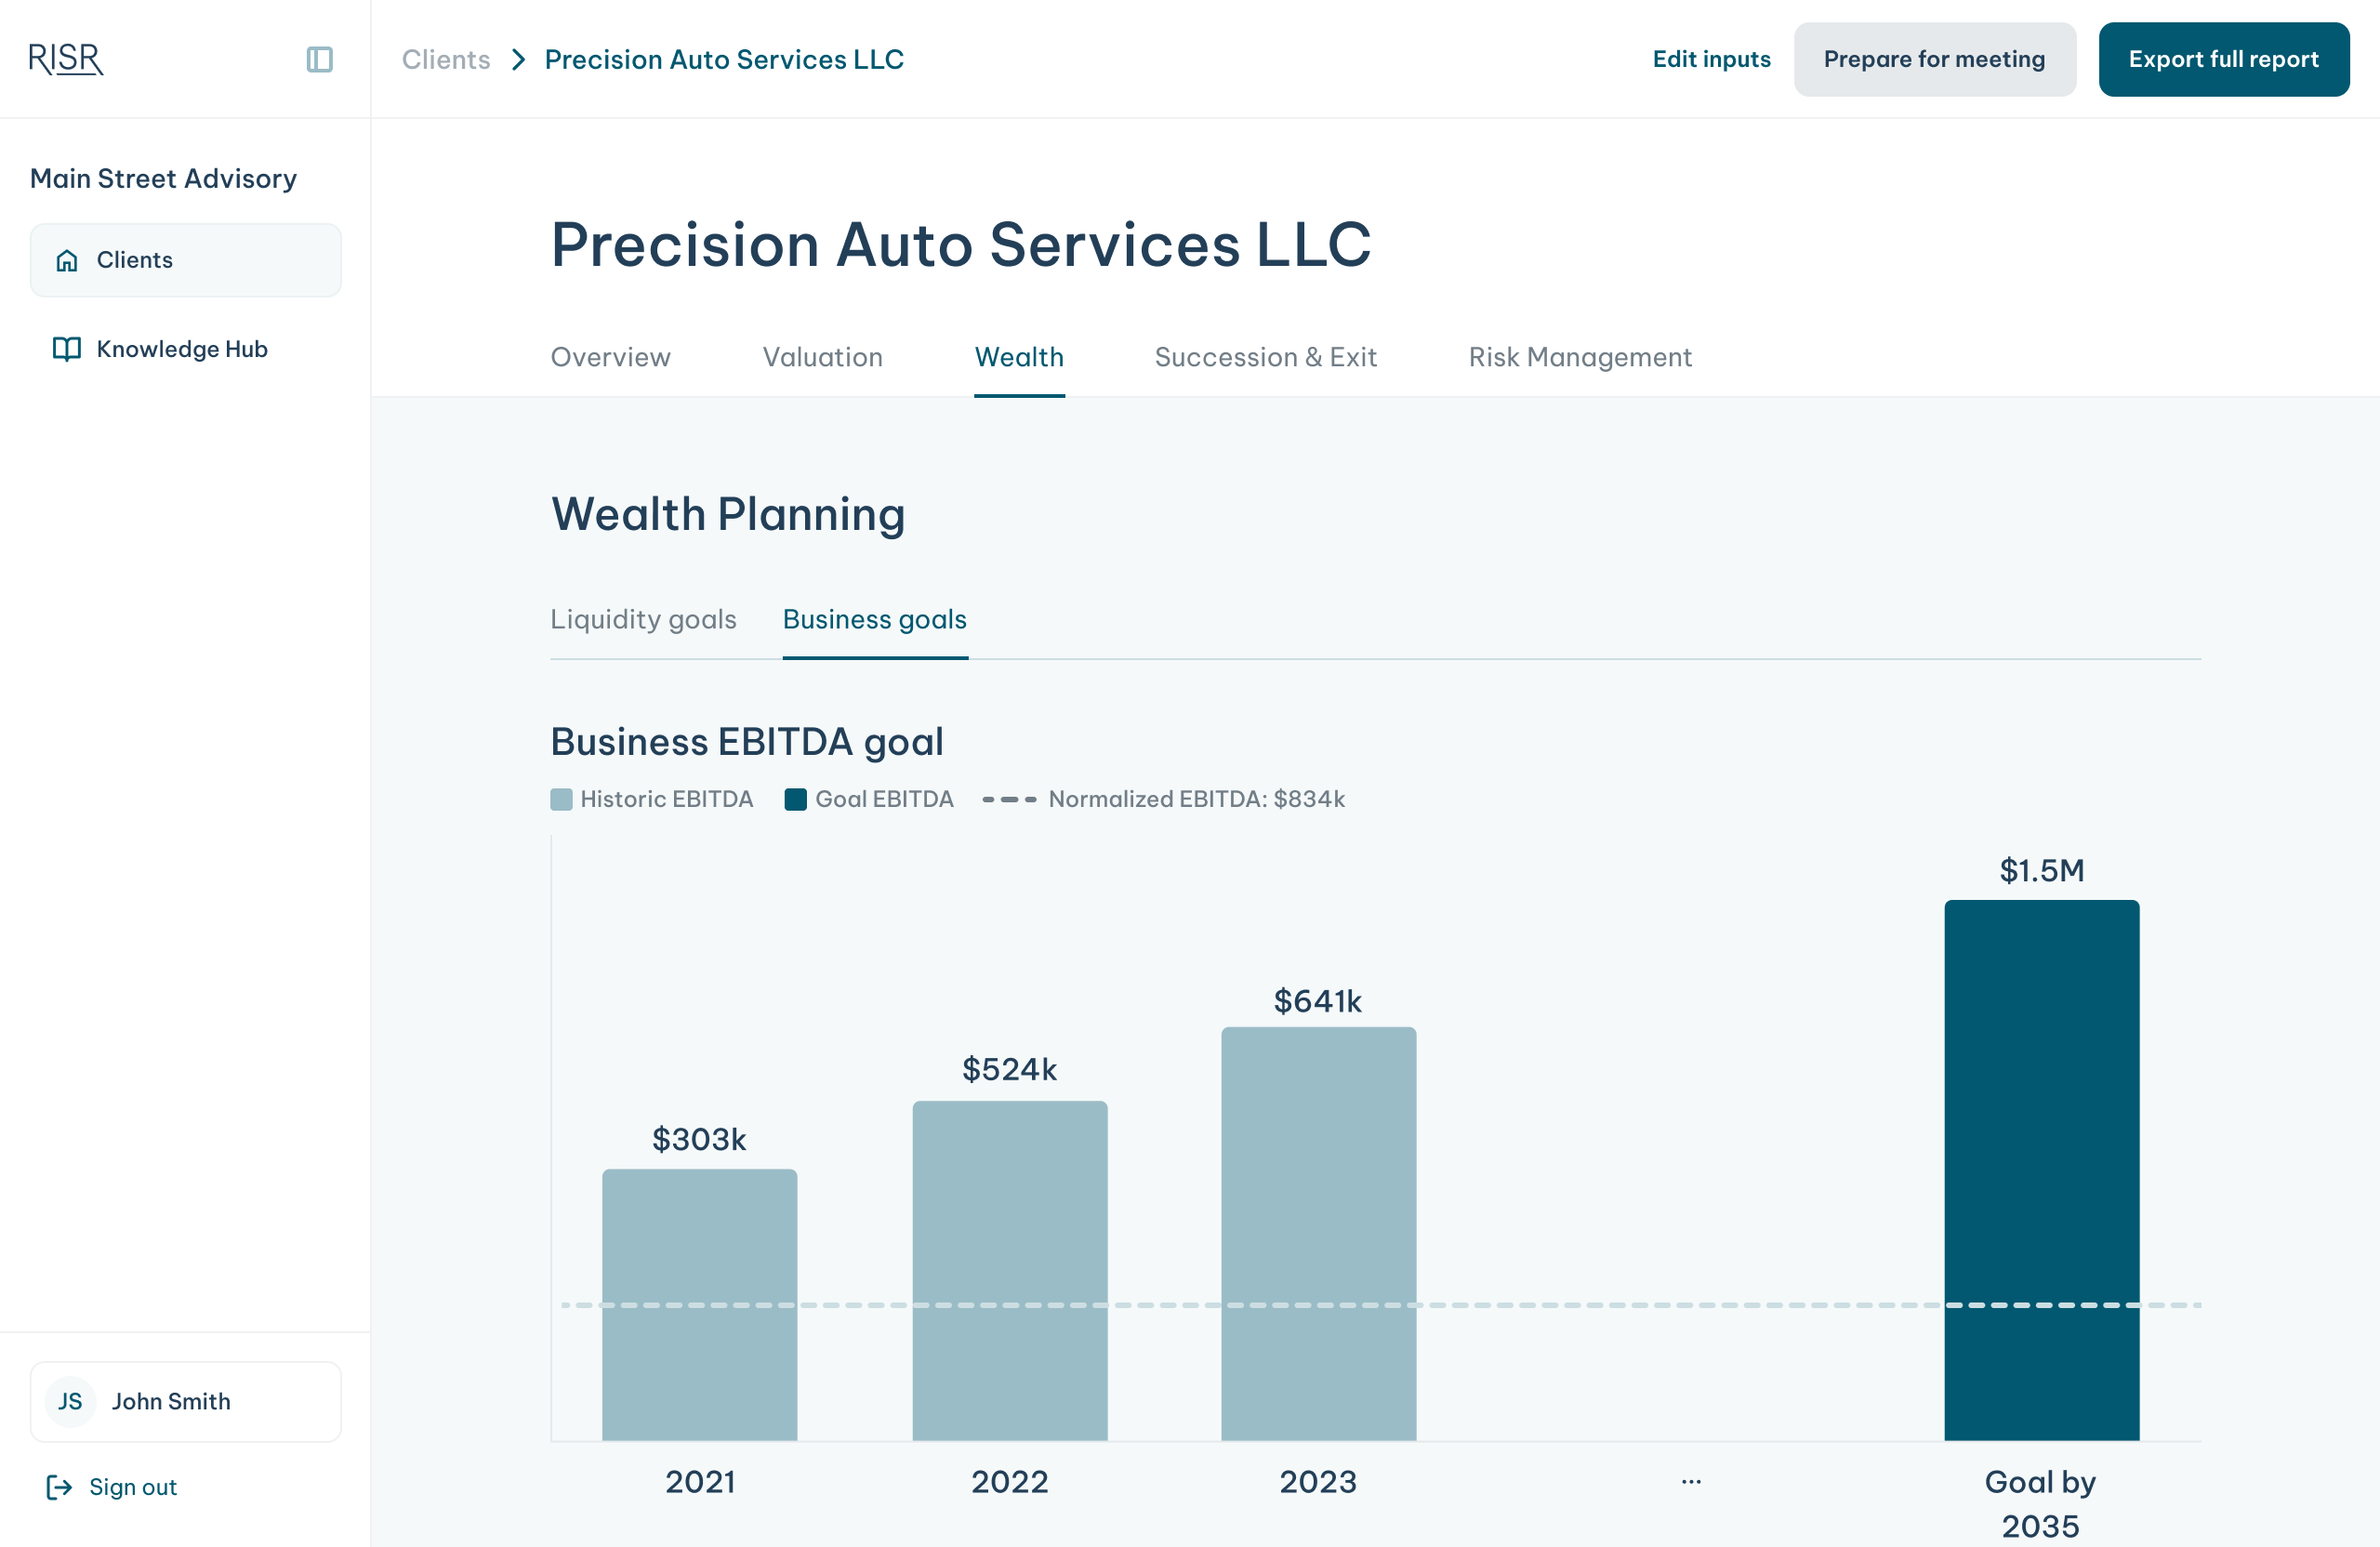
Advisors didn’t want to present static reports. They wanted to explore scenarios live with clients, adjusting assumptions in real time and watching the numbers respond. That became the north star for the redesign. The IA followed four principles:
Advisors wanted to explore scenarios live — not present static reports. The IA followed four principles to make that possible.
Highest-leverage data surfaces first so clients can orient immediately and watch it update.
Detail increases as you scroll down, letting advisors change conversation altitude without losing context.
Advisors can adjust assumptions without navigating away and breaking the flow of conversation.
Advisors can jump between service areas as the client’s priorities shift.
…but where should those numbers dance?
“Let the numbers dance” was the vision. But valuation alone wasn’t enough surface area. Advisors needed to follow the client’s conversation wherever it went: retirement, liquidity, succession, risk — without hitting a wall.
Valuation alone wasn’t enough — advisors needed to follow any conversation without hitting a wall.
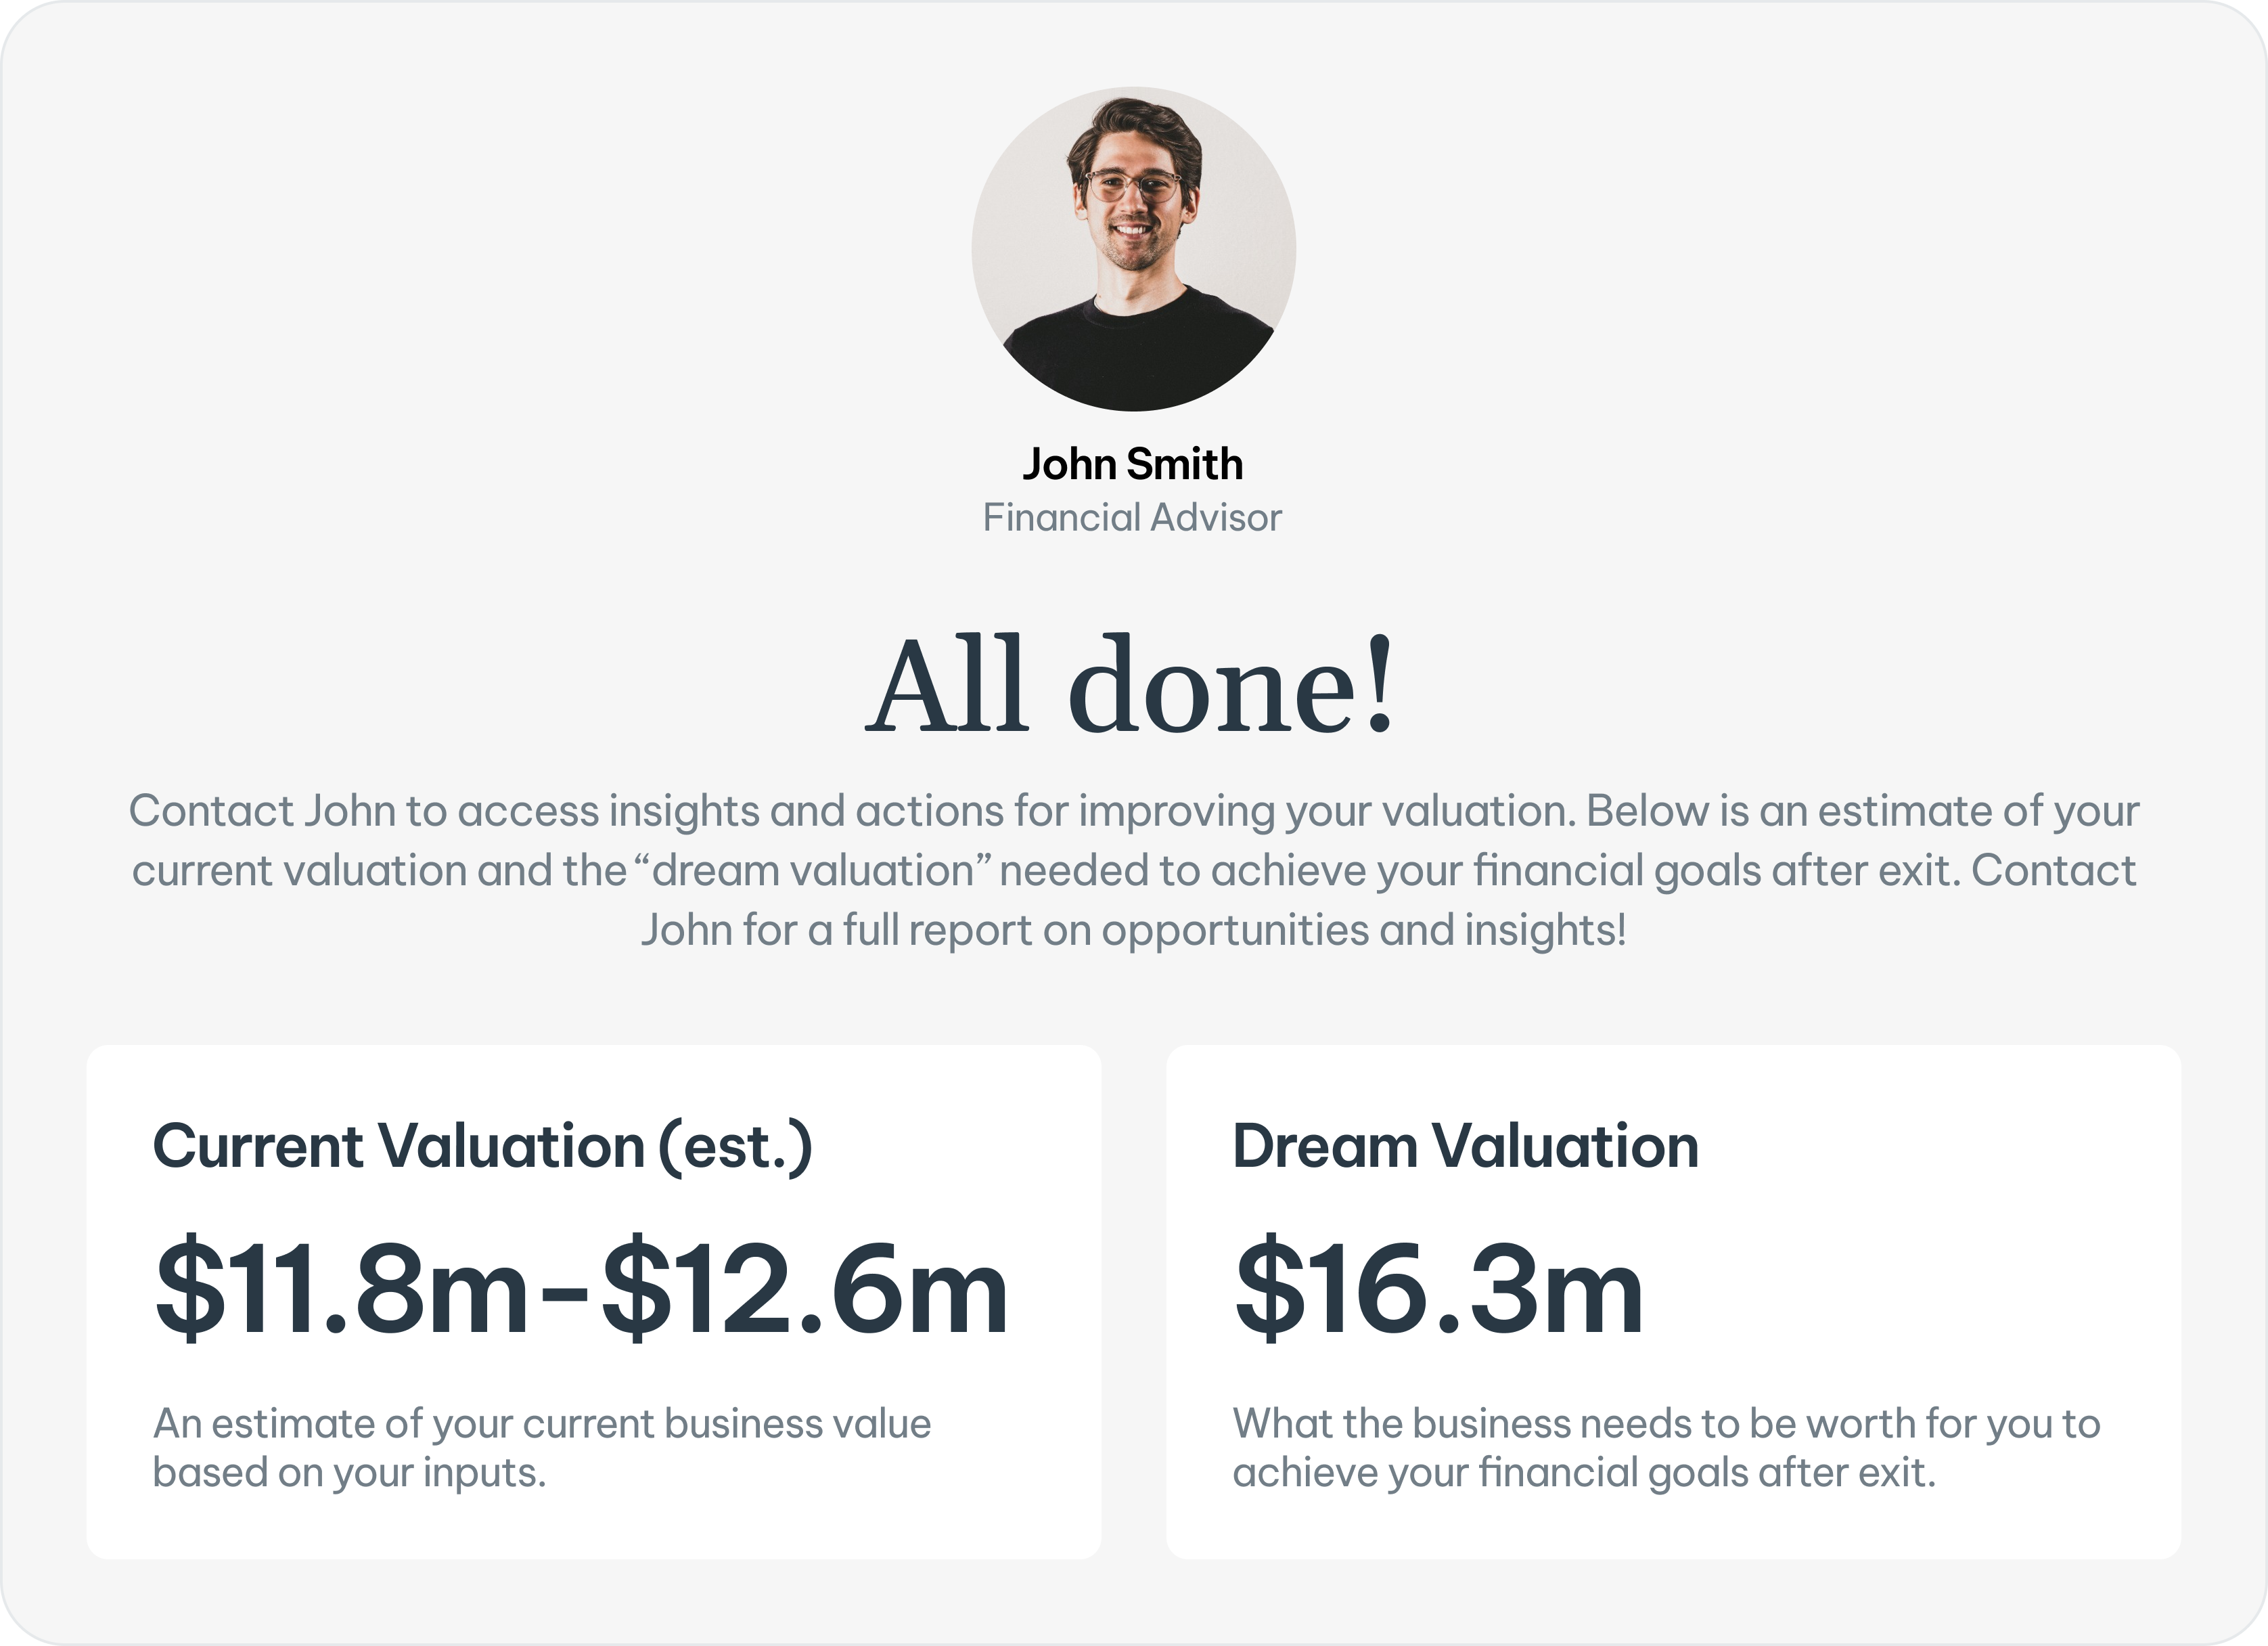
V1 focused solely on valuation, leaving advisors directionless after closing deals. No path to ongoing conversations.
Prioritizing service areas to fill out the relationship
the constraint
We had hundreds of existing clients in the system. Adding new service areas meant either collecting more data from them or extracting new insights from what we already had.
Adding new service areas meant using data we already had — collecting new data was a non-starter.
The decision
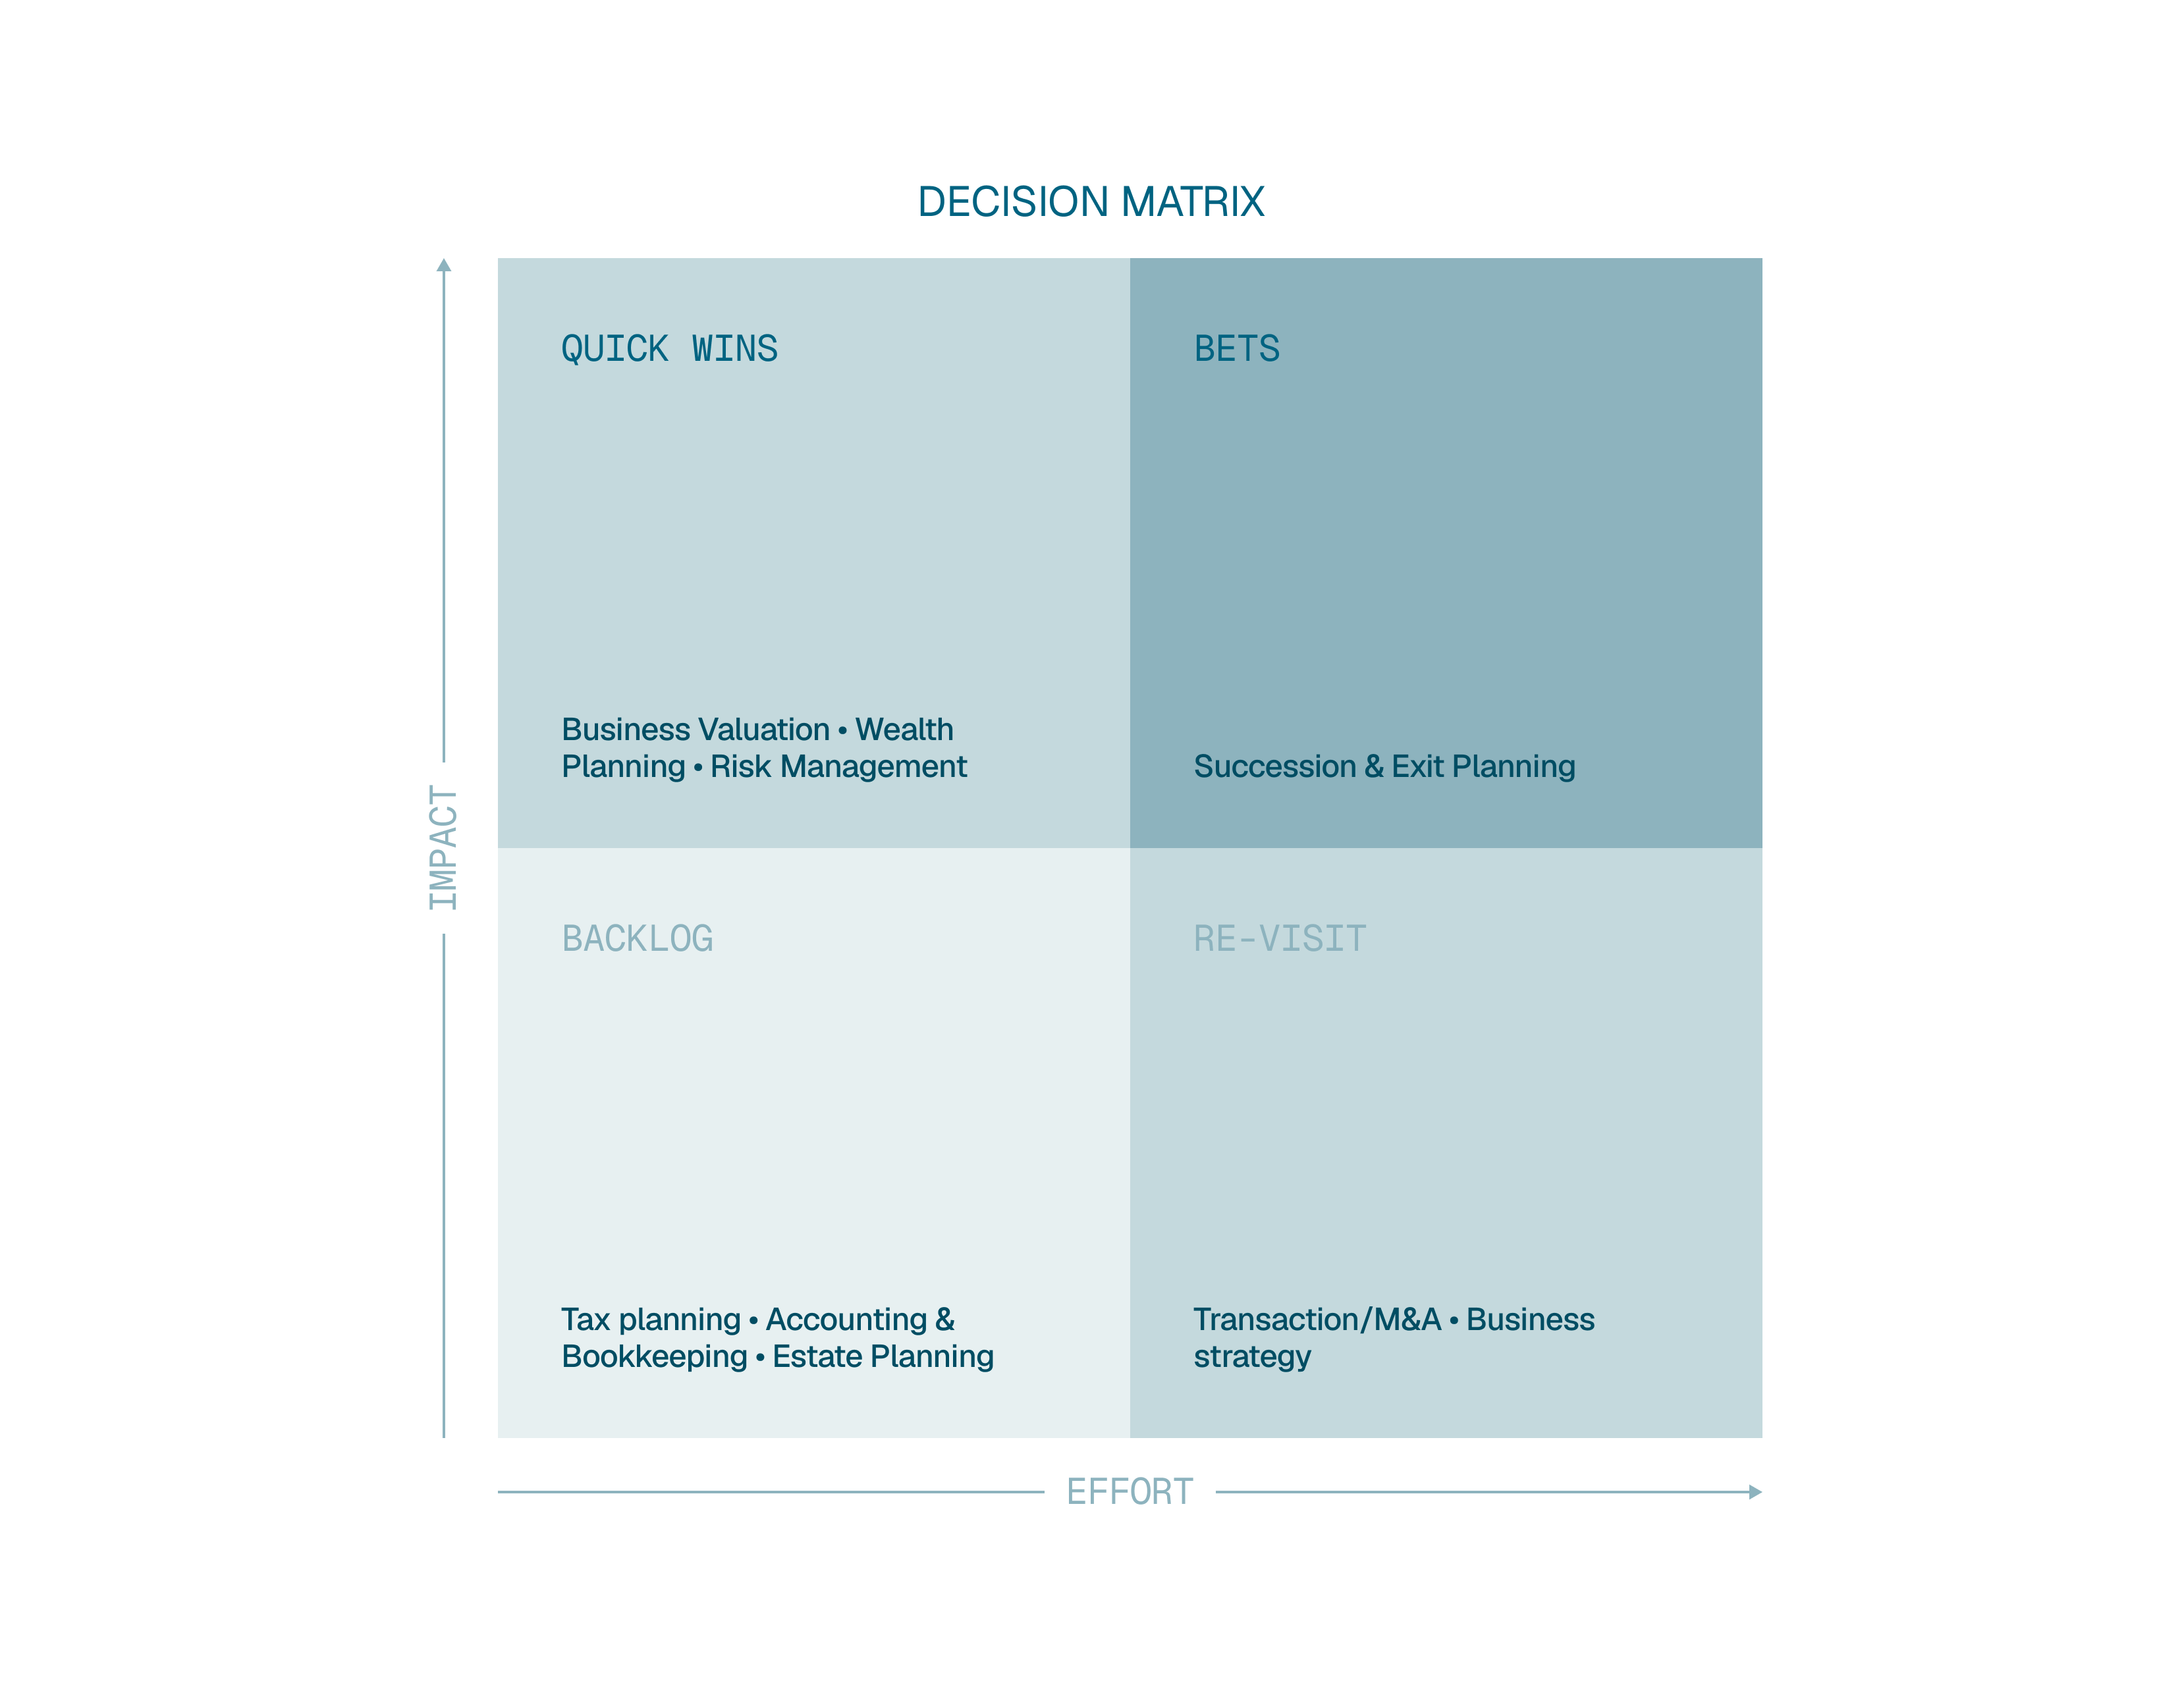
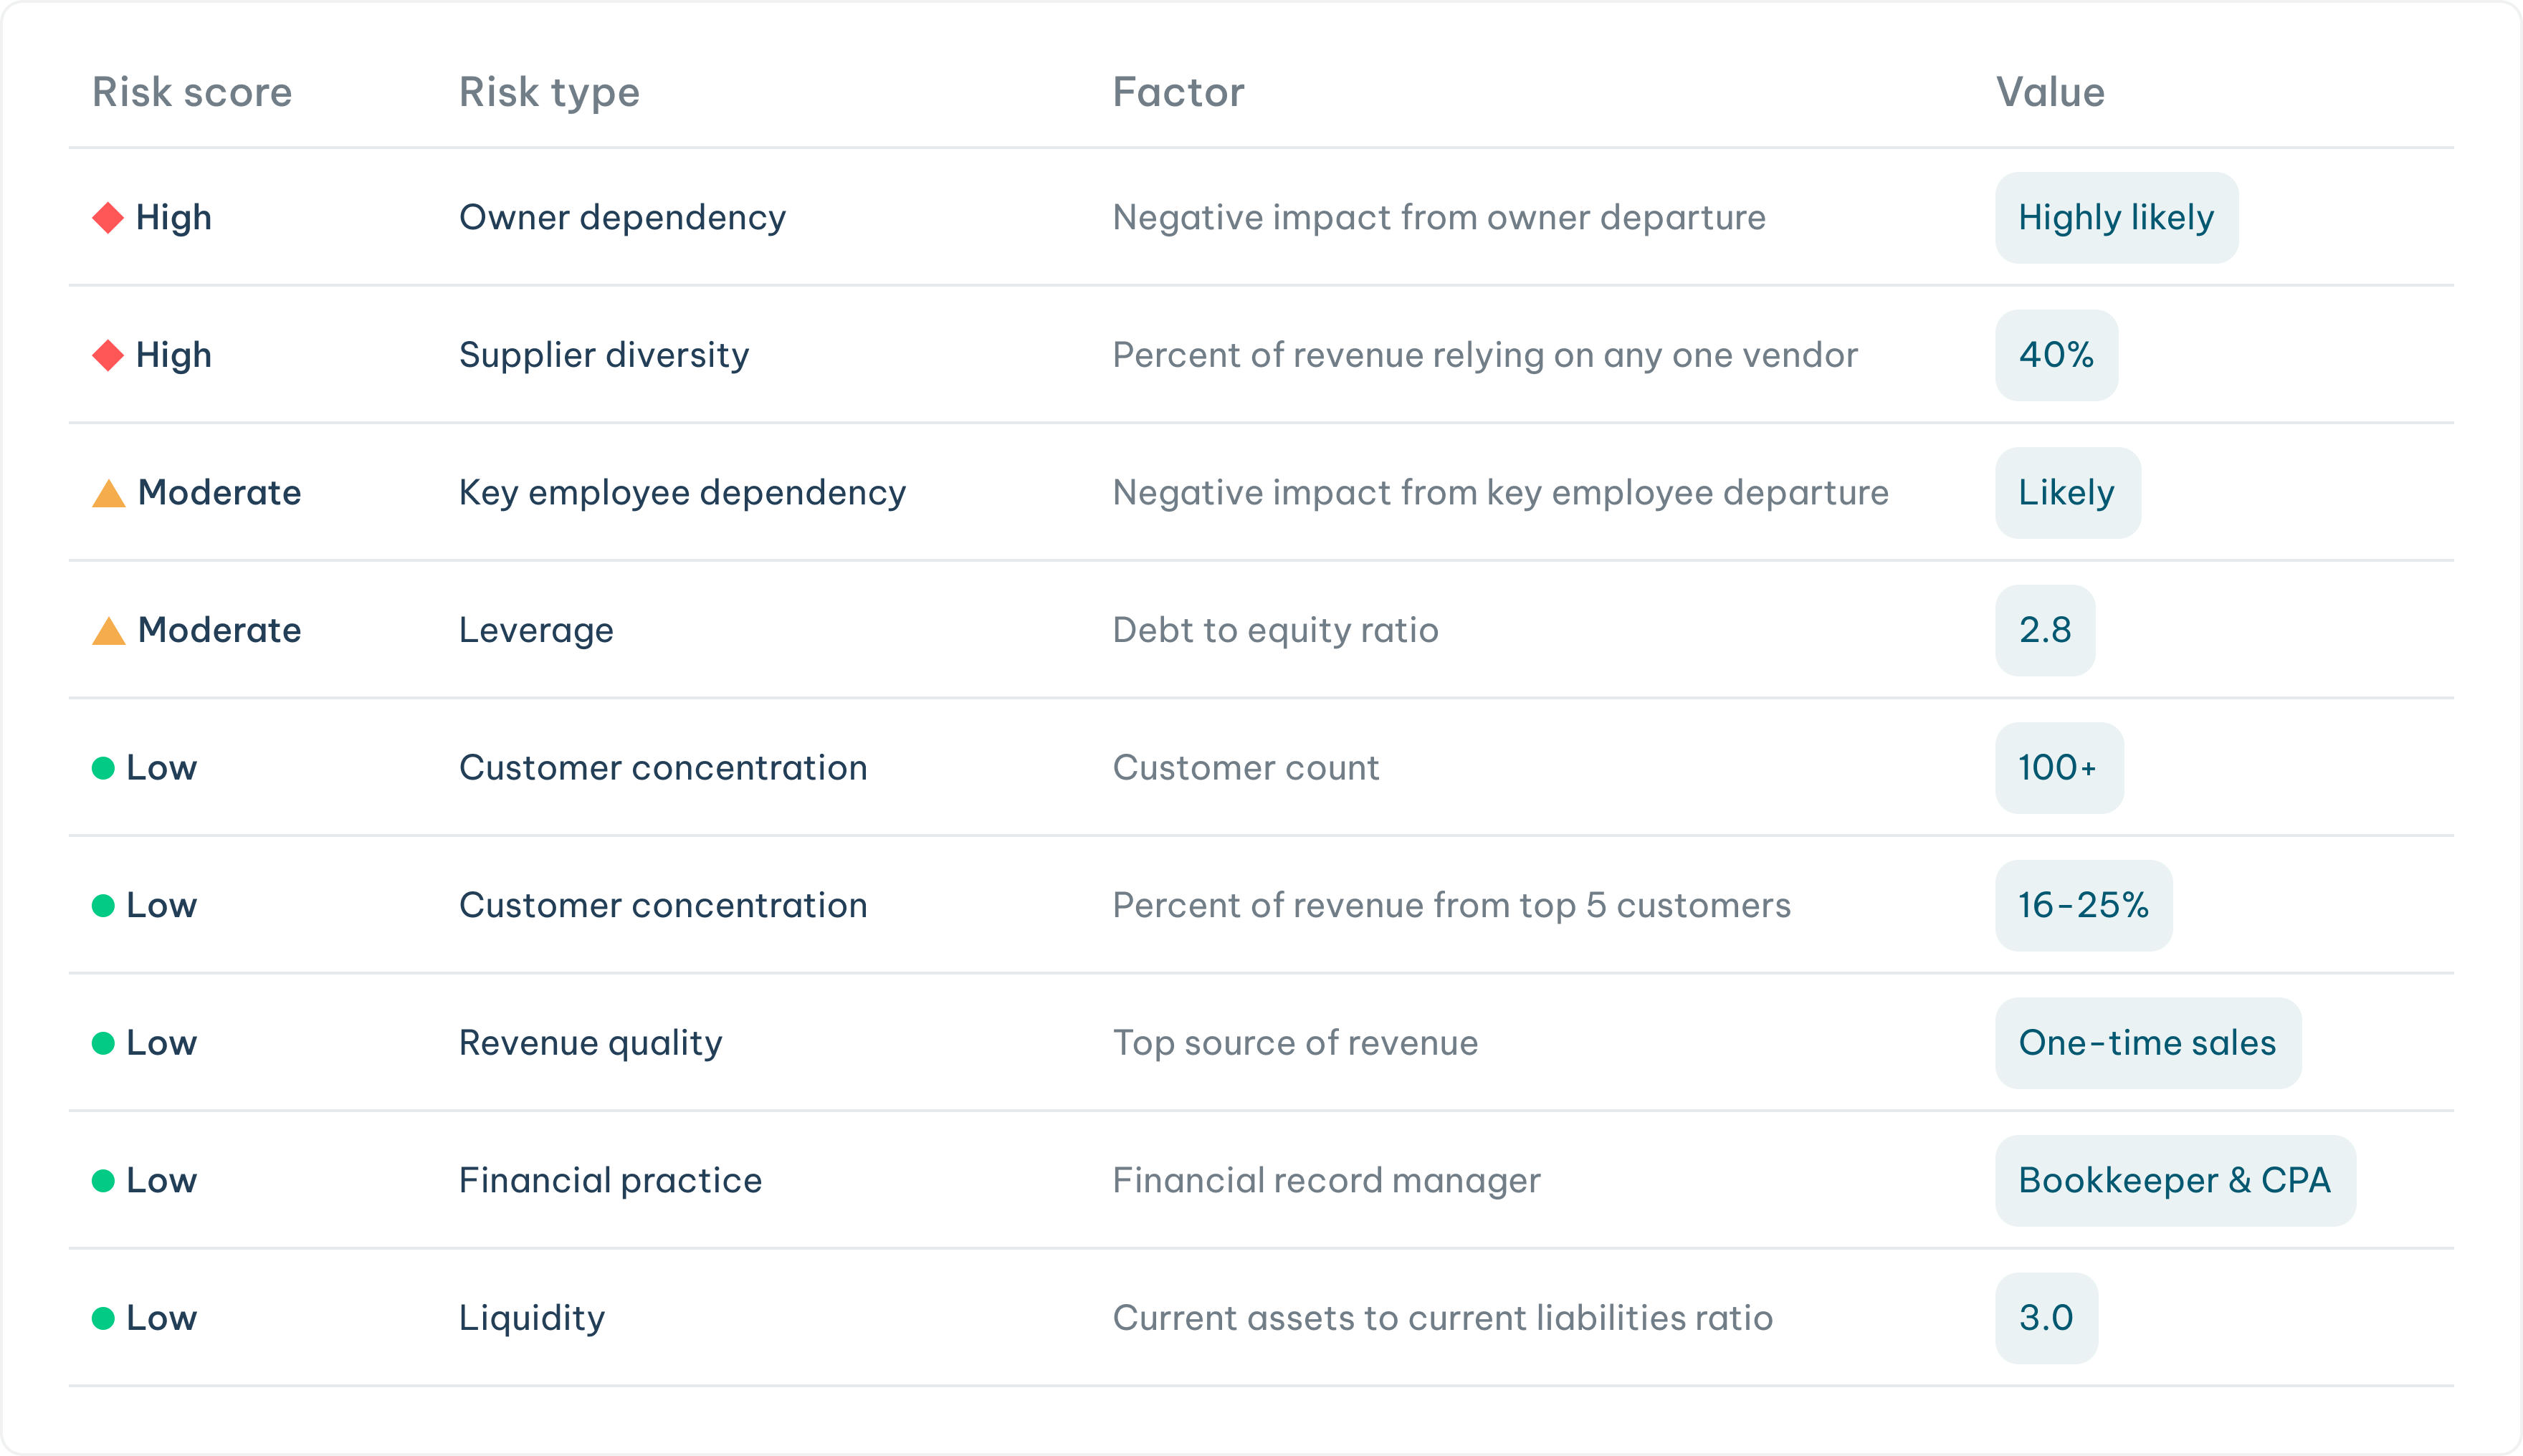
I mapped our existing data against advisor priority service areas and business owner needs. We identified four areas: Business Valuation, Wealth Planning, Succession & Exit, and Risk Management. All four could be built without touching data collection.
We identified four service areas — Valuation, Wealth Planning, Succession & Exit, Risk Management — all buildable without new data.
The trade-off & outcome
We said no to tax planning and M&A advisory because they required new data and would have fractured the experience. Existing clients got the expanded platform on day one. In one release, we increased surface area 4x.
We cut tax planning and M&A — existing clients got the full expanded platform on day one.
Iterating towards clarity: Focus vs. Flexibility
Iteration 1: Embedded flow

Iteration 2: Tabular flexibility
design rationale
When we initially designed a layout for the service areas, we started with action cards that let advisors drill into separate pages for each service area. After feedback revealed advisors wanted to move between areas even more fluidly, we switched to a tabbing system with an overview page as the conversation starting point.
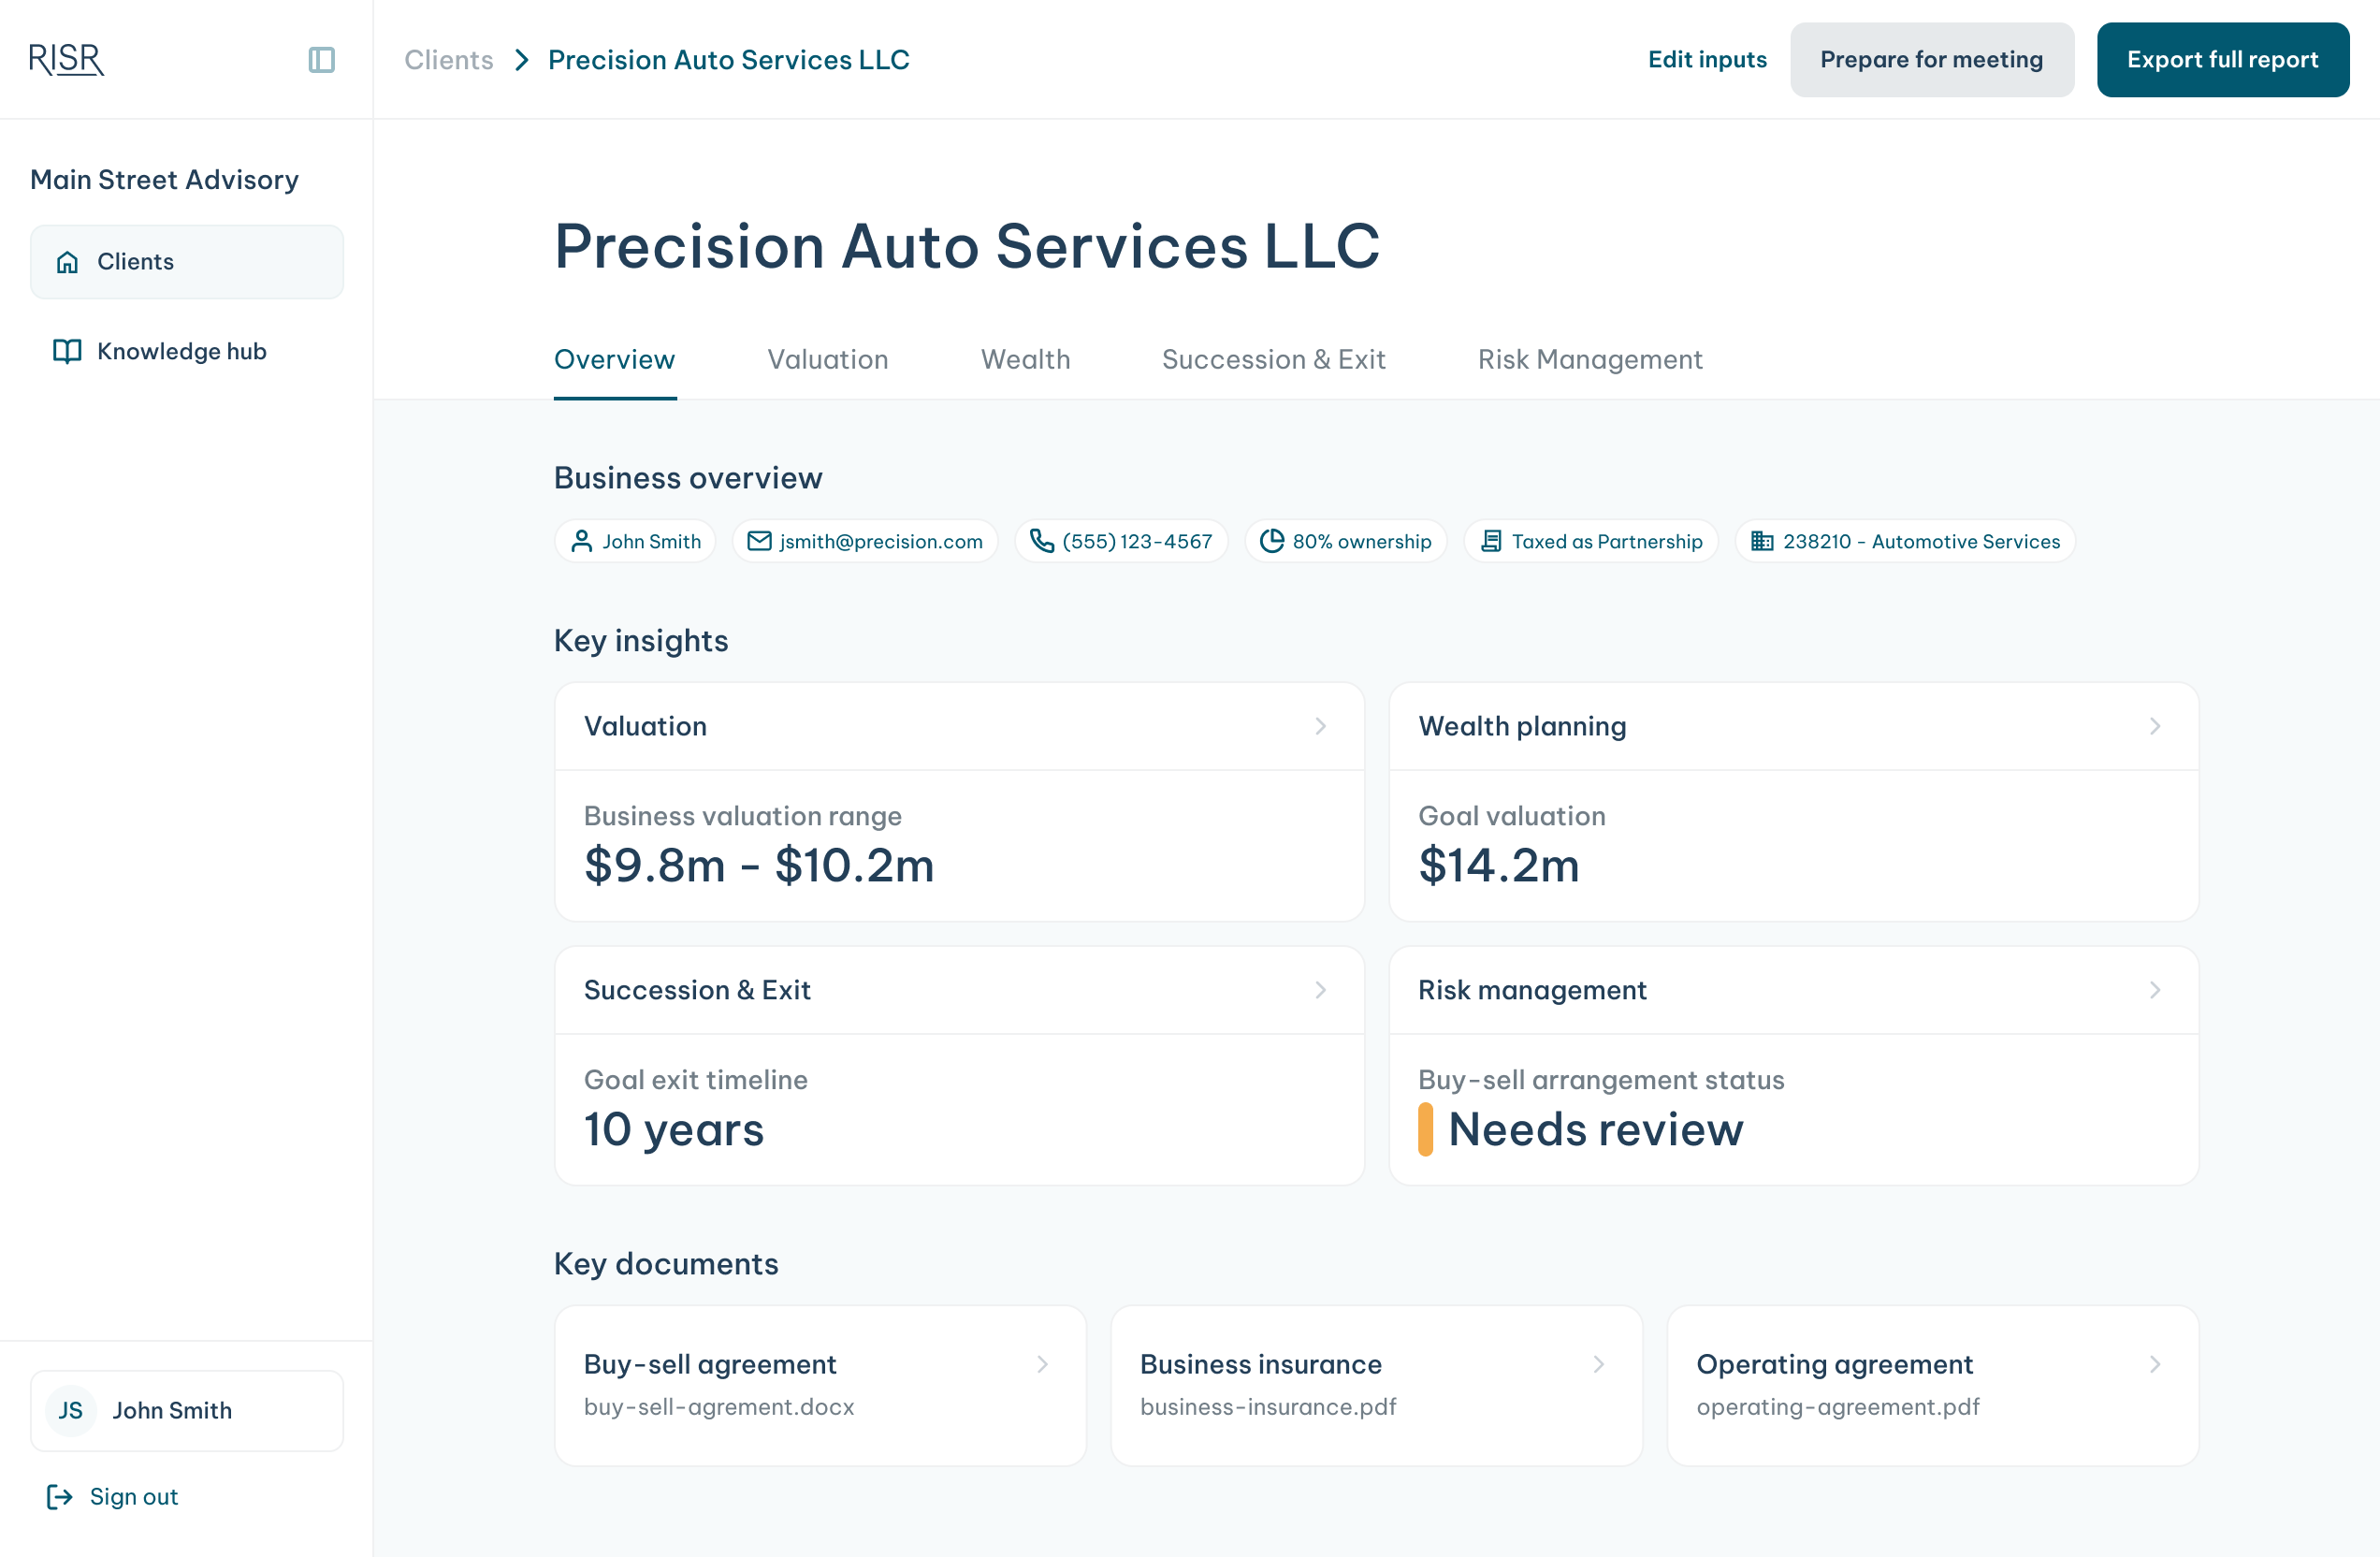
After feedback, we switched to a tab system with an overview page as the conversation anchor.
Real-time updates weren’t feasible
Two weeks before we planned to lock hi-fis, engineering came back with bad news: our backend couldn’t support live updates. The way our system processed raw data into insights meant real-time editing would grind the dashboard to a halt.
Two weeks before locking hi-fis, engineering told us our backend couldn’t support live updates.
We were halfway through hi-fis for Wealth Planning and Business Valuation when engineering surfaced the constraint.
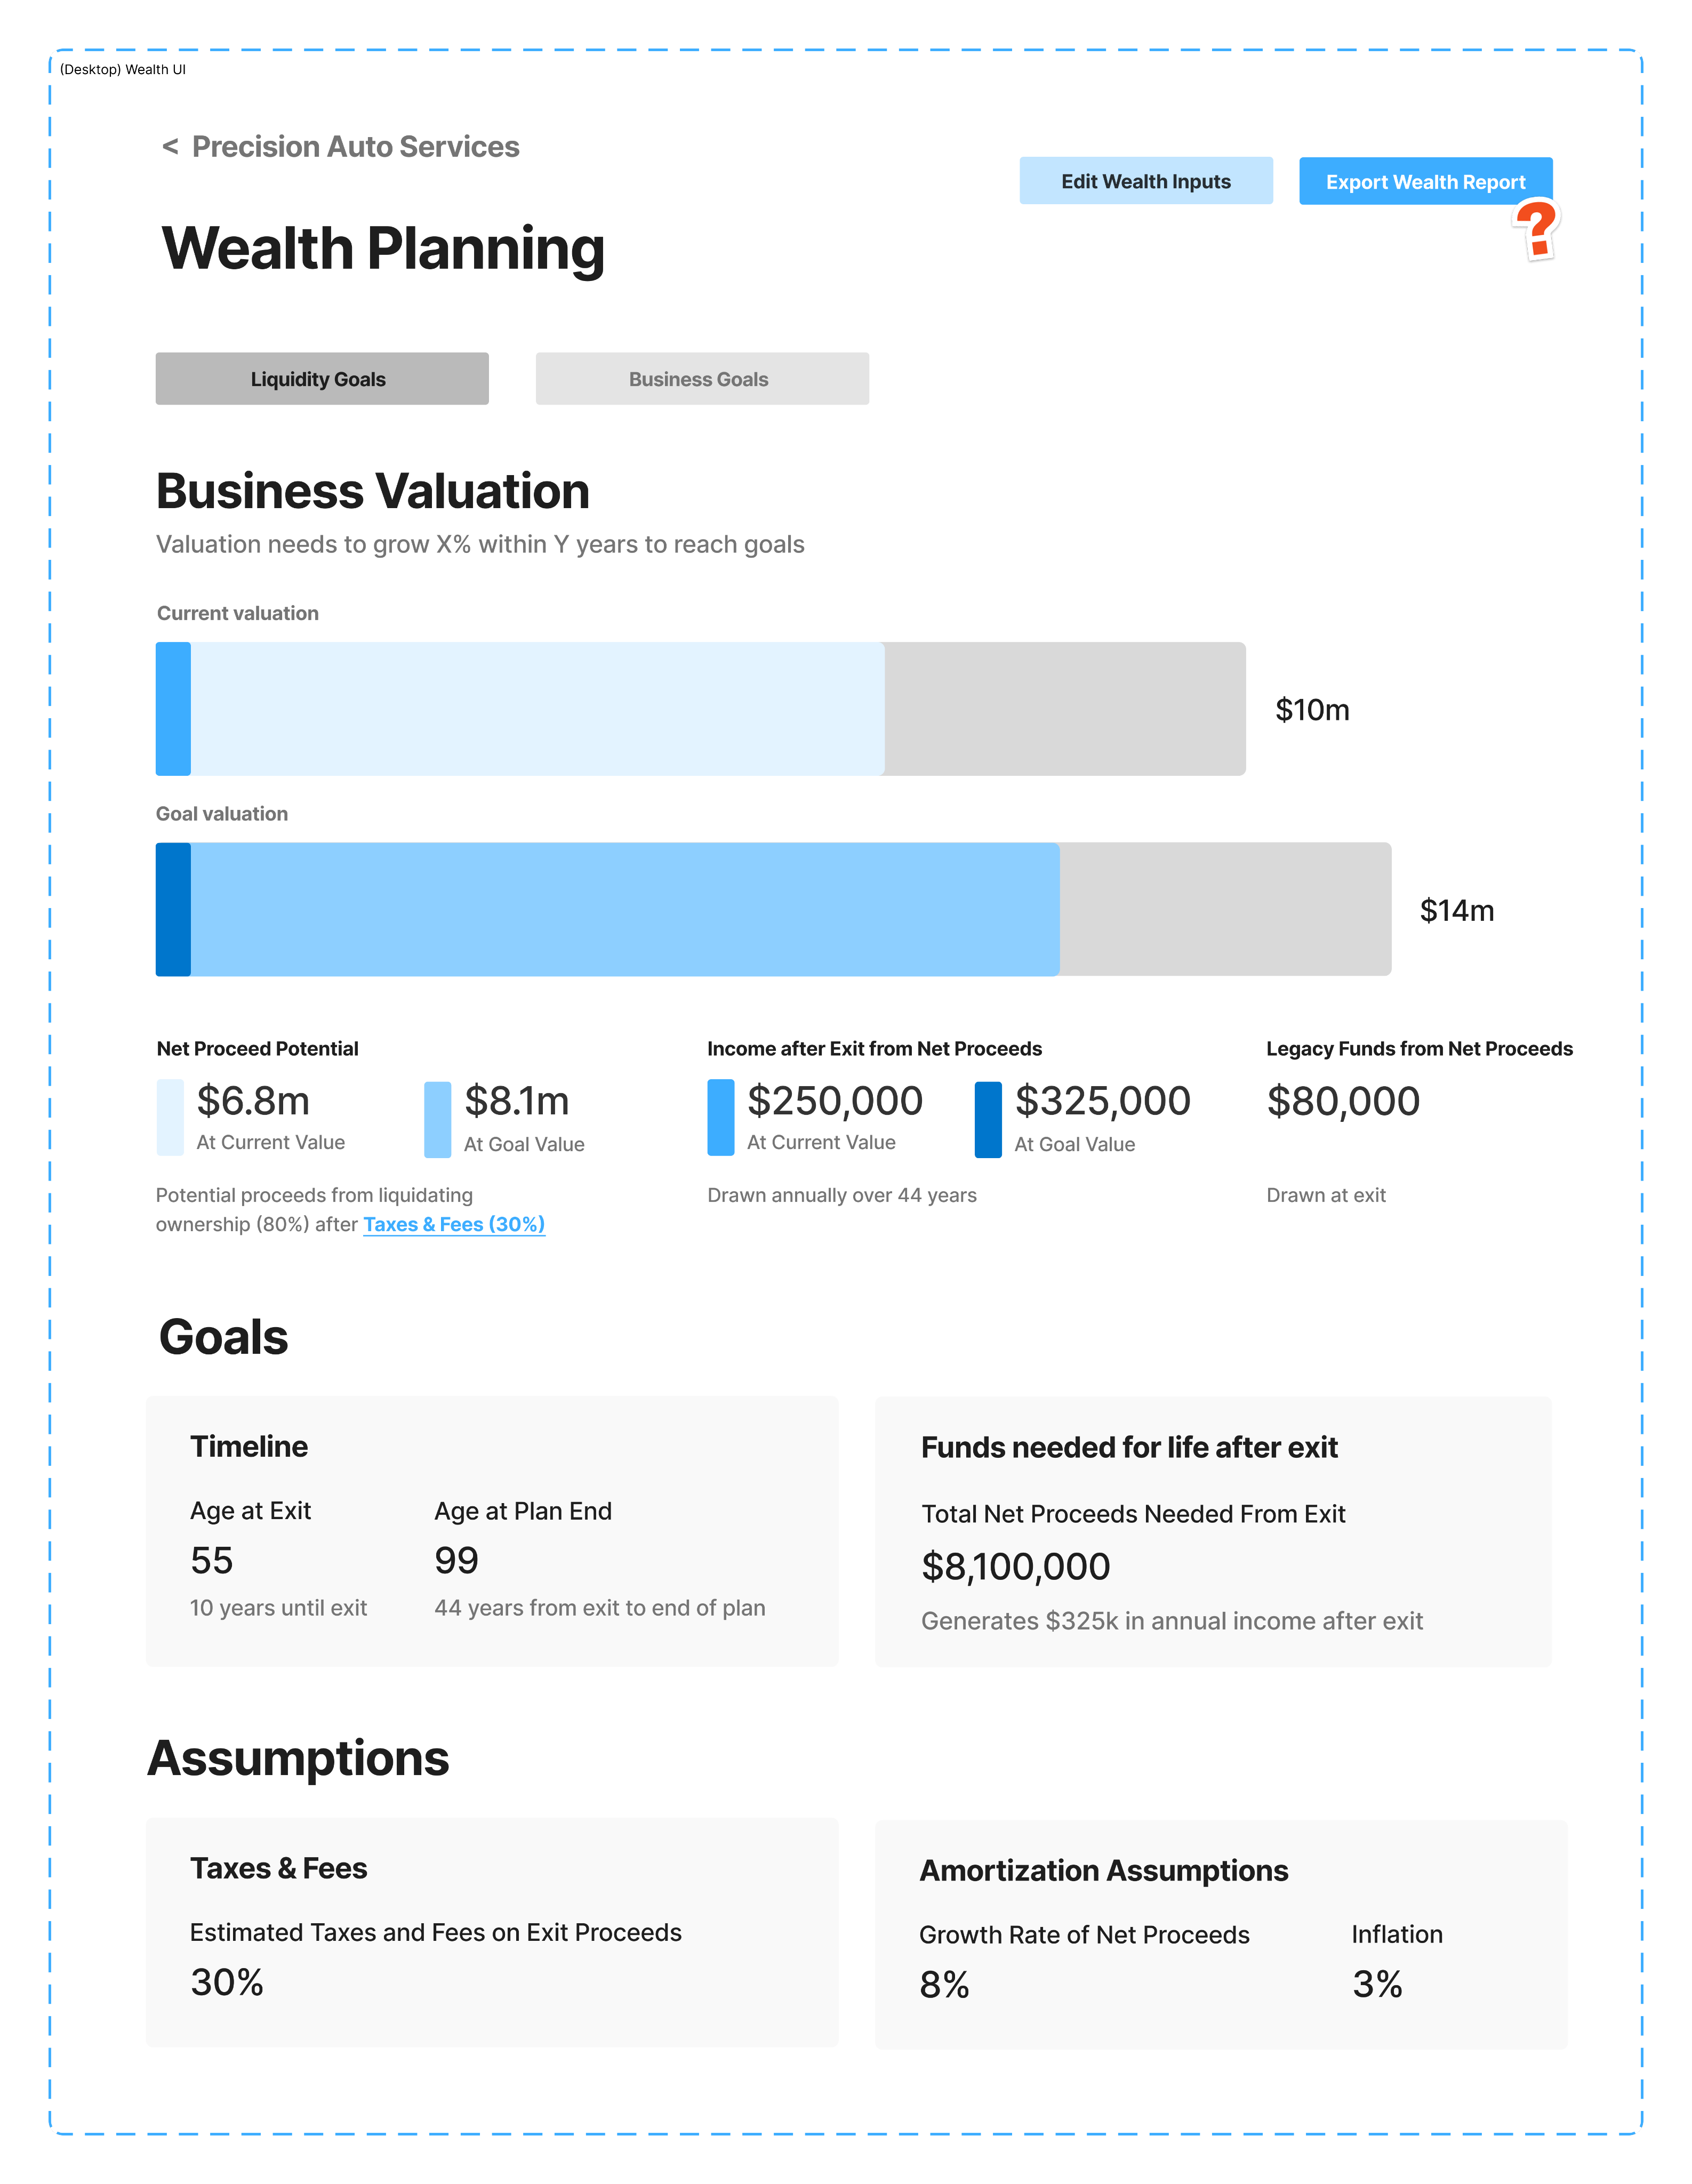
We carried “let the numbers dance” into hi-fis by embedding live editing directly onto the dashboards.
Our north star — advisors watching numbers change live with clients — was technically impossible within our timeline.
The options
We had two options. Push the timeline and lose our first-to-market window on succession & exit planning, or compromise the interaction and ship a slightly-better-but-still-static calculator. Neither were ideal.
Push the timeline and lose our market window, or ship a slightly-better calculator. Neither were ideal.
The third path
I got in a room with the lead engineer and head of product to search for a third option.
Together, we realized that advisors didn’t actually need the numbers to update as they typed. They needed to feel in control: to make a change and see the update without disrupting the conversation. Those were the same on the surface but fundamentally different on the back-end, and one of them was feasible.
Advisors didn’t need instant updates — they needed to feel in control. Those are different things on the back-end.
I partnered with the lead engineer and head of product to design a workaround: a contextual edit flow.
We stripped live editing from all four dashboards and explored alternatives in one day.
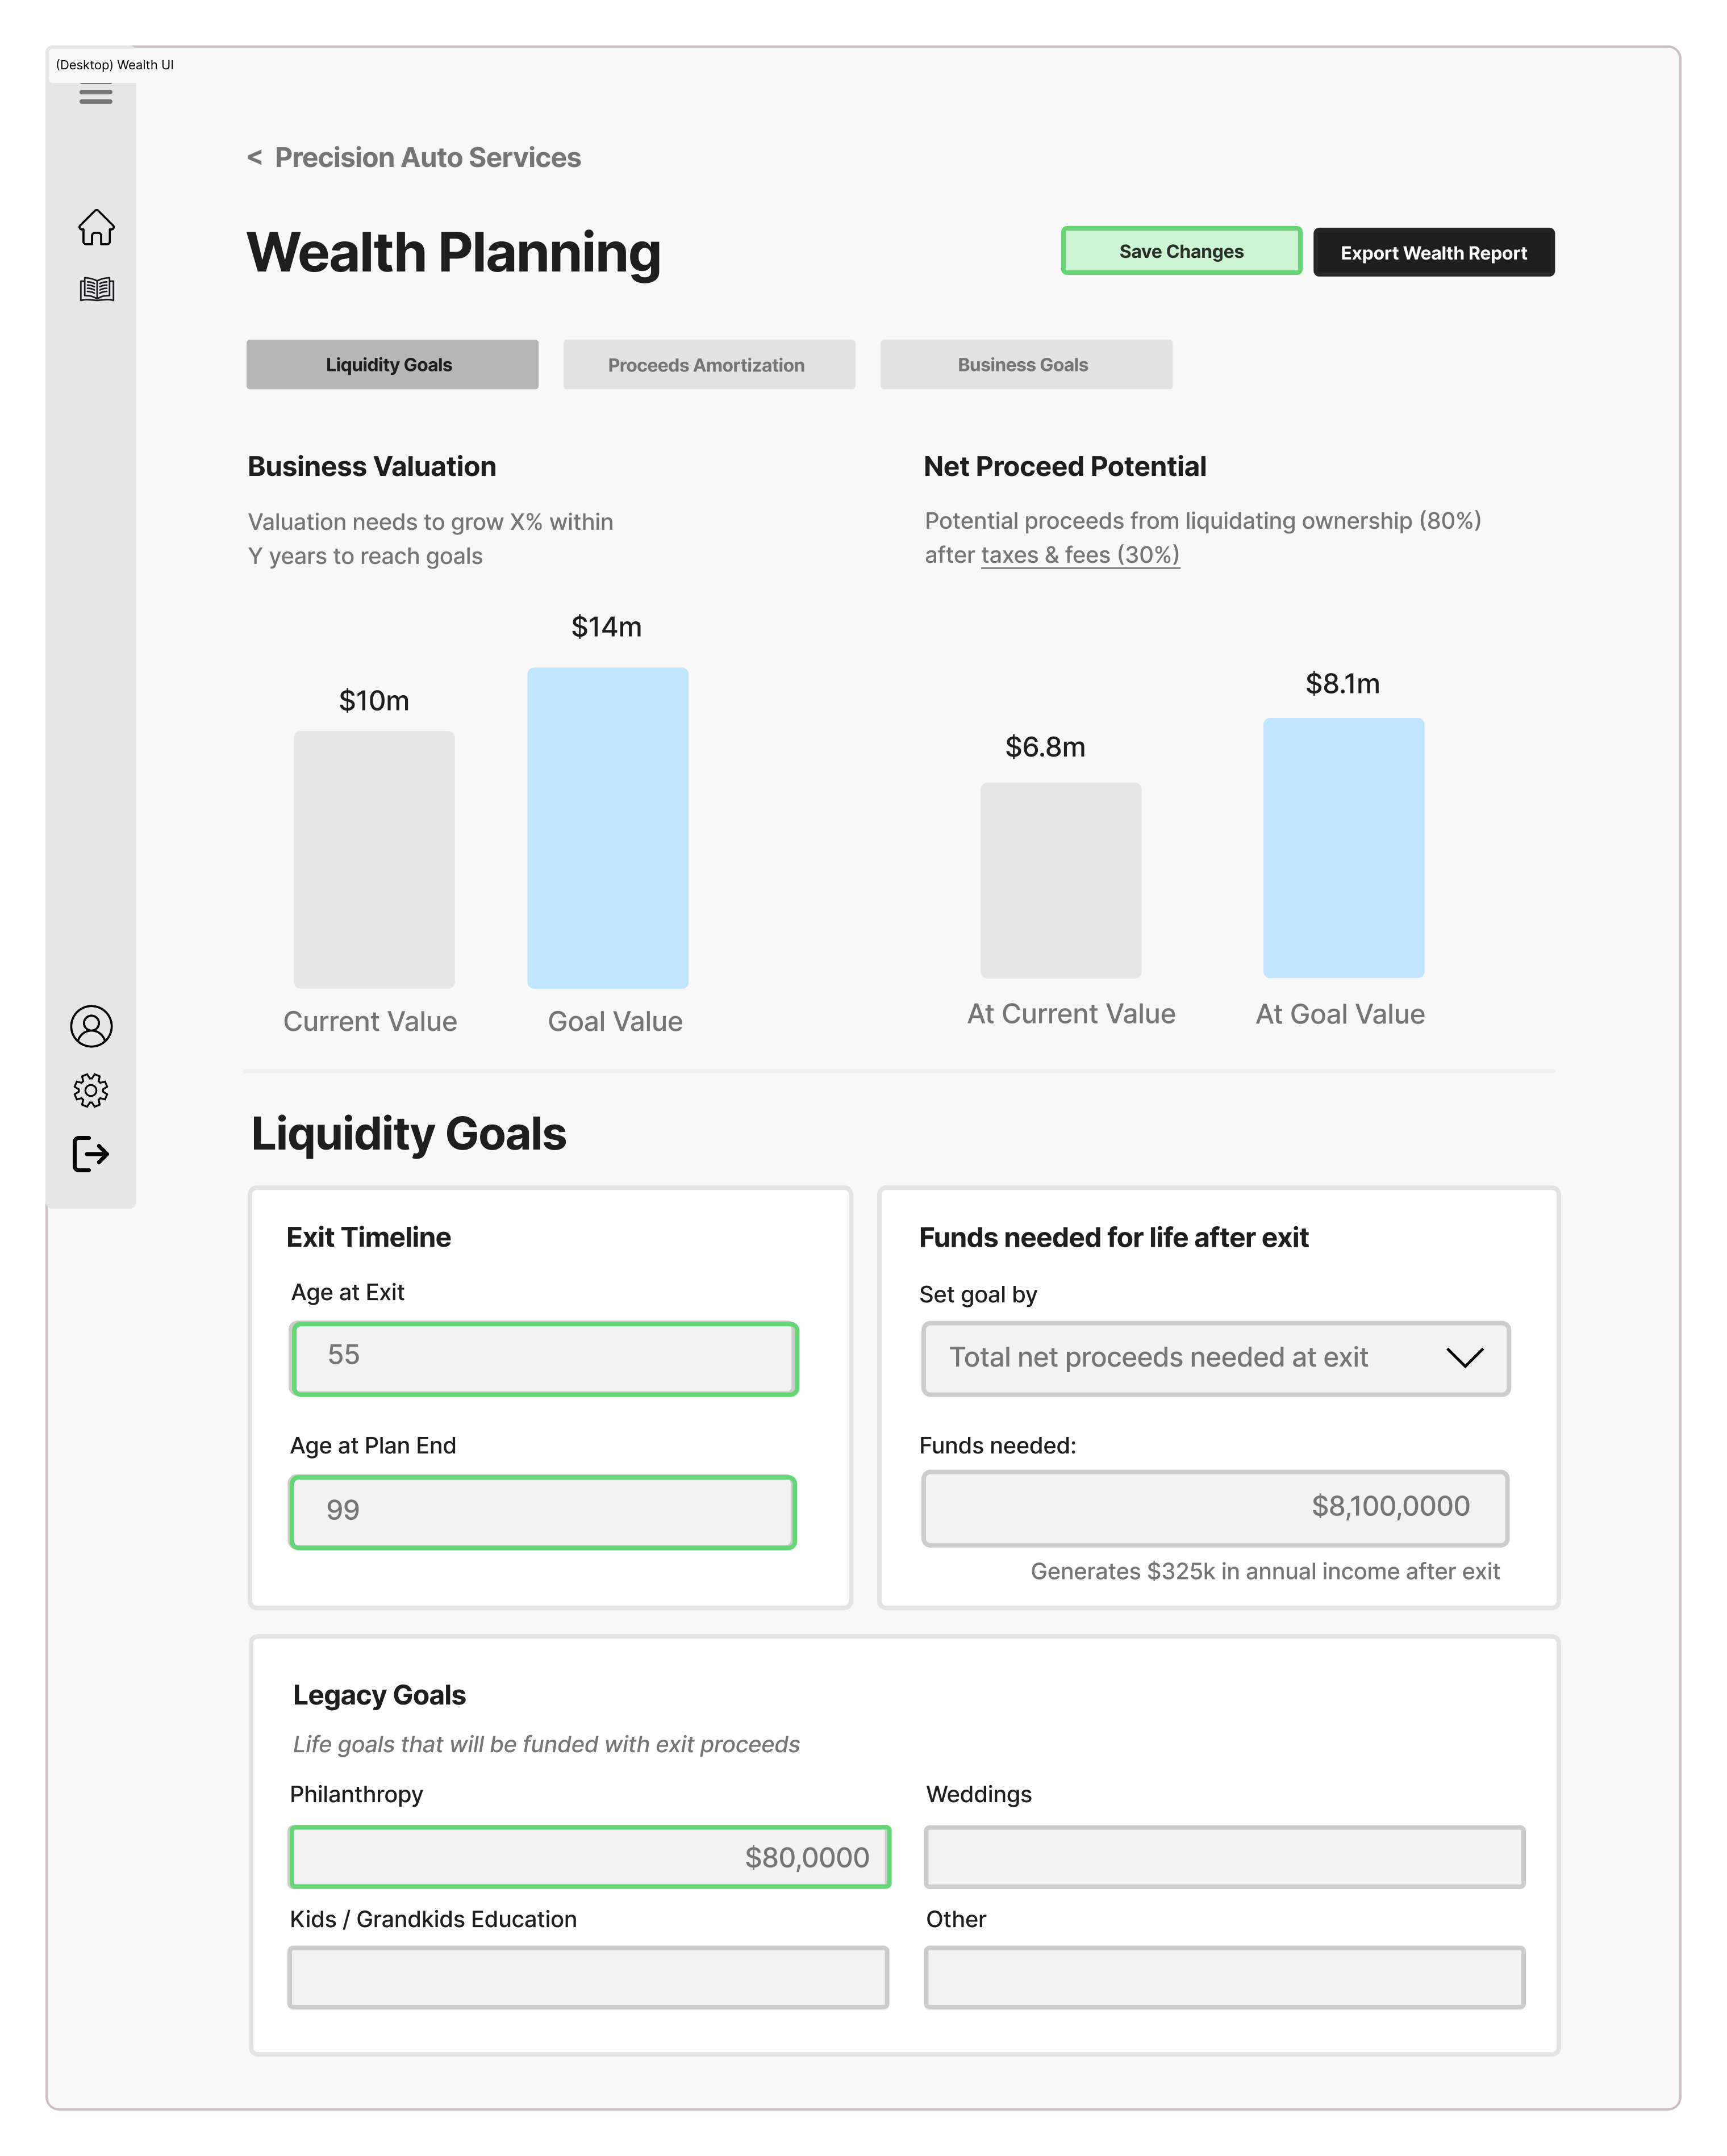
The contextual edit flow: advisors jump to inputs, edit, save, and watch the dashboard update.
Advisors jump directly to the inputs affecting their current view, make changes, hit “Save & Return,” and watch the dashboard update.
Advisors jump to any input, edit, save, and watch the dashboard update — the interaction feels live.
The update happened in a two-second loop, not instantaneously. Advisors didn’t care.
They cared that they could respond to a client question on the spot, adjust an assumption, and keep the conversation moving.
We launched in August as planned. First to market. North star intact.
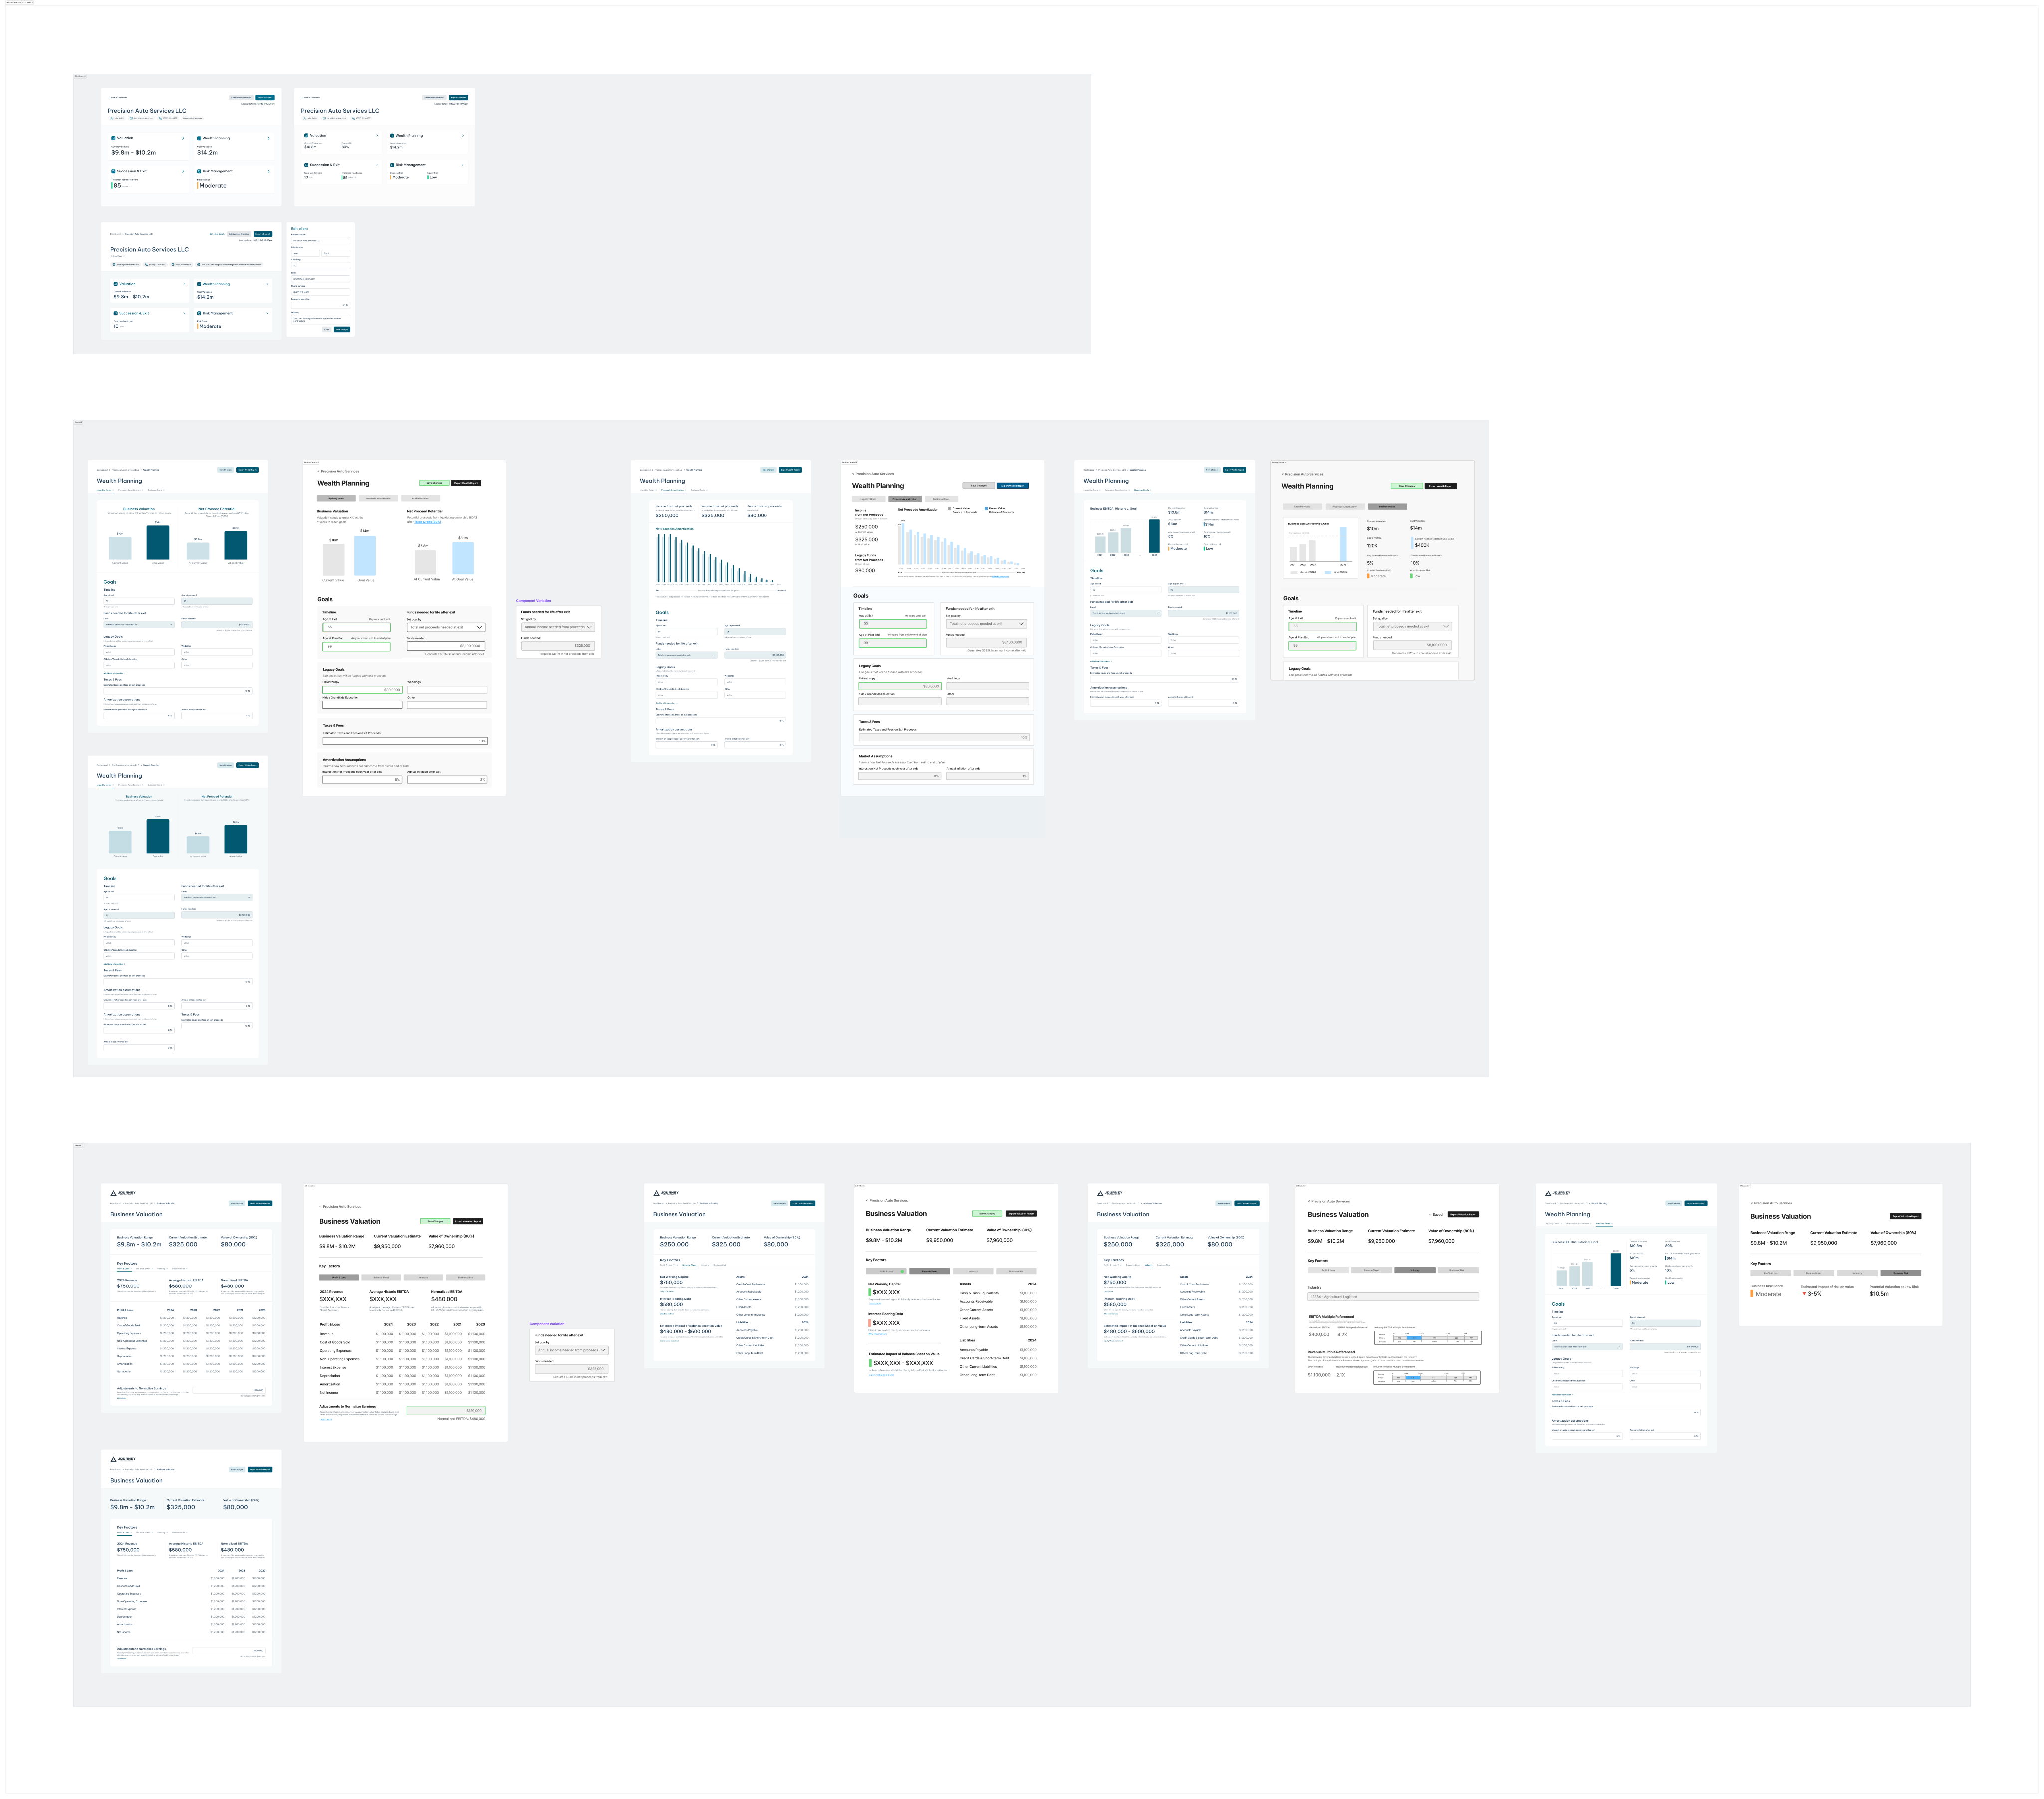
What got shipped in four months
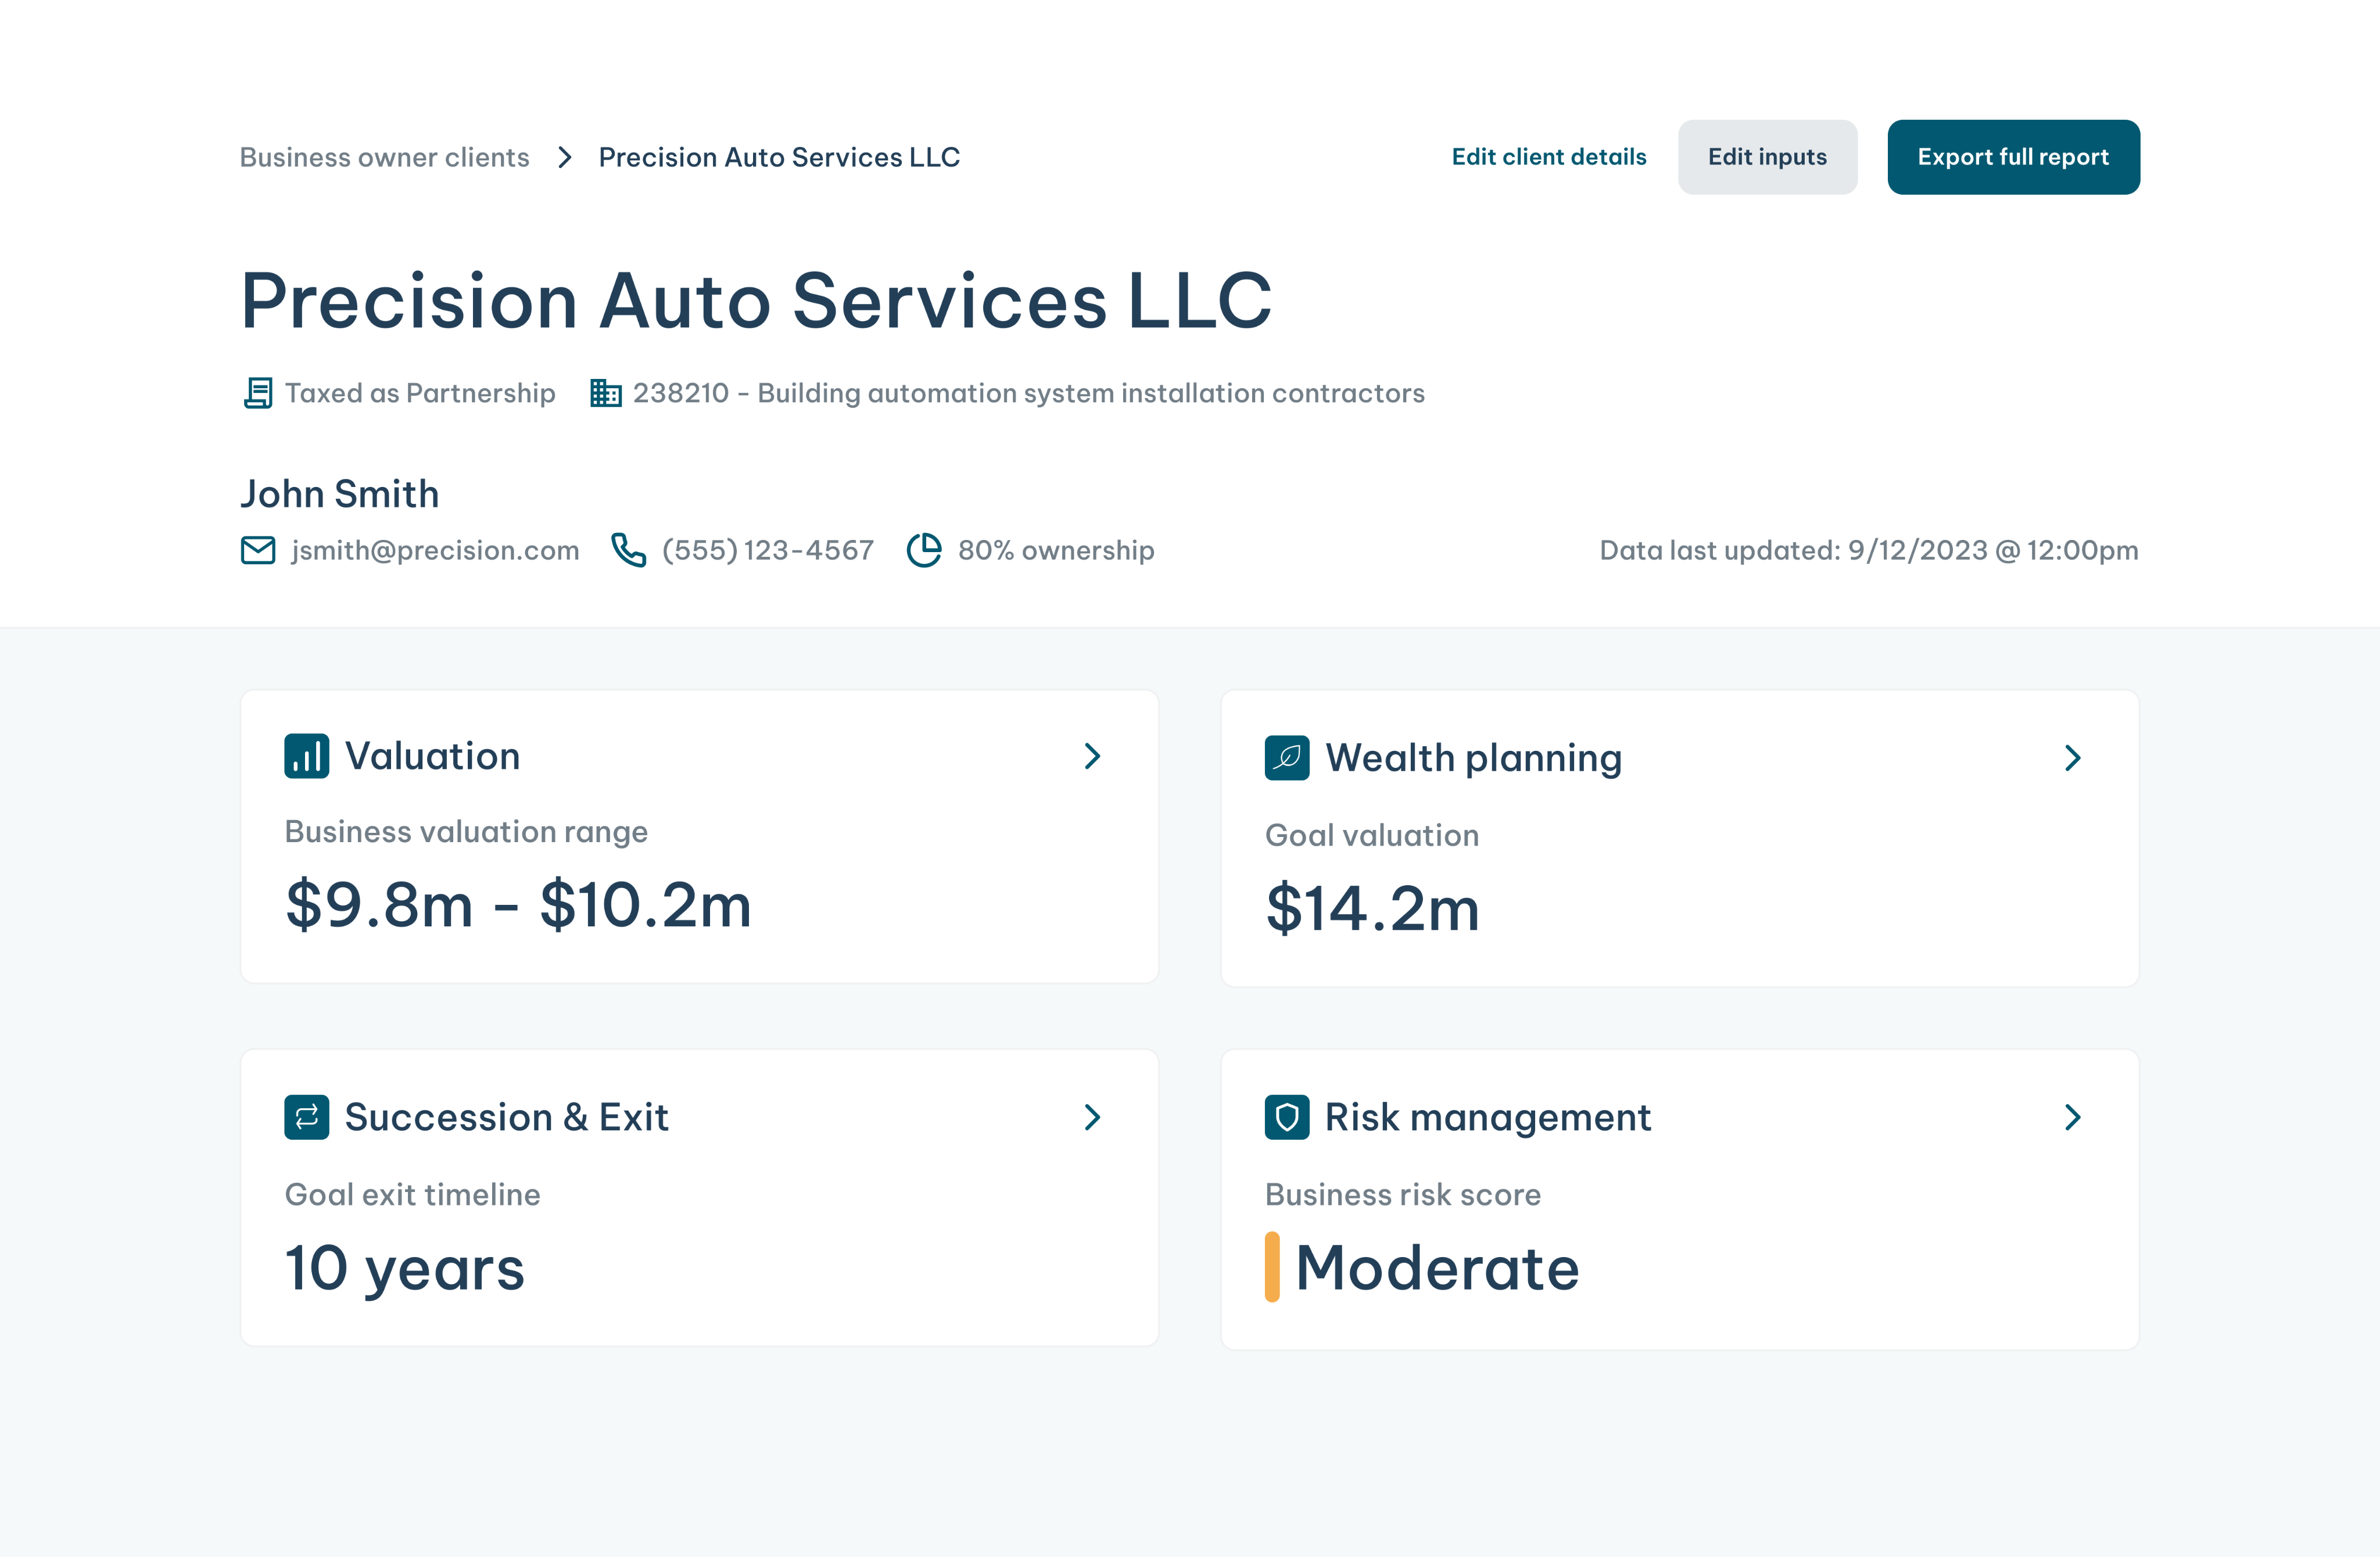
Advisors could kick off a conversation on the overview page then move between service areas to follow the natural flow of conversation.
Advisors could start on the overview and move between service areas to follow the natural conversation flow.
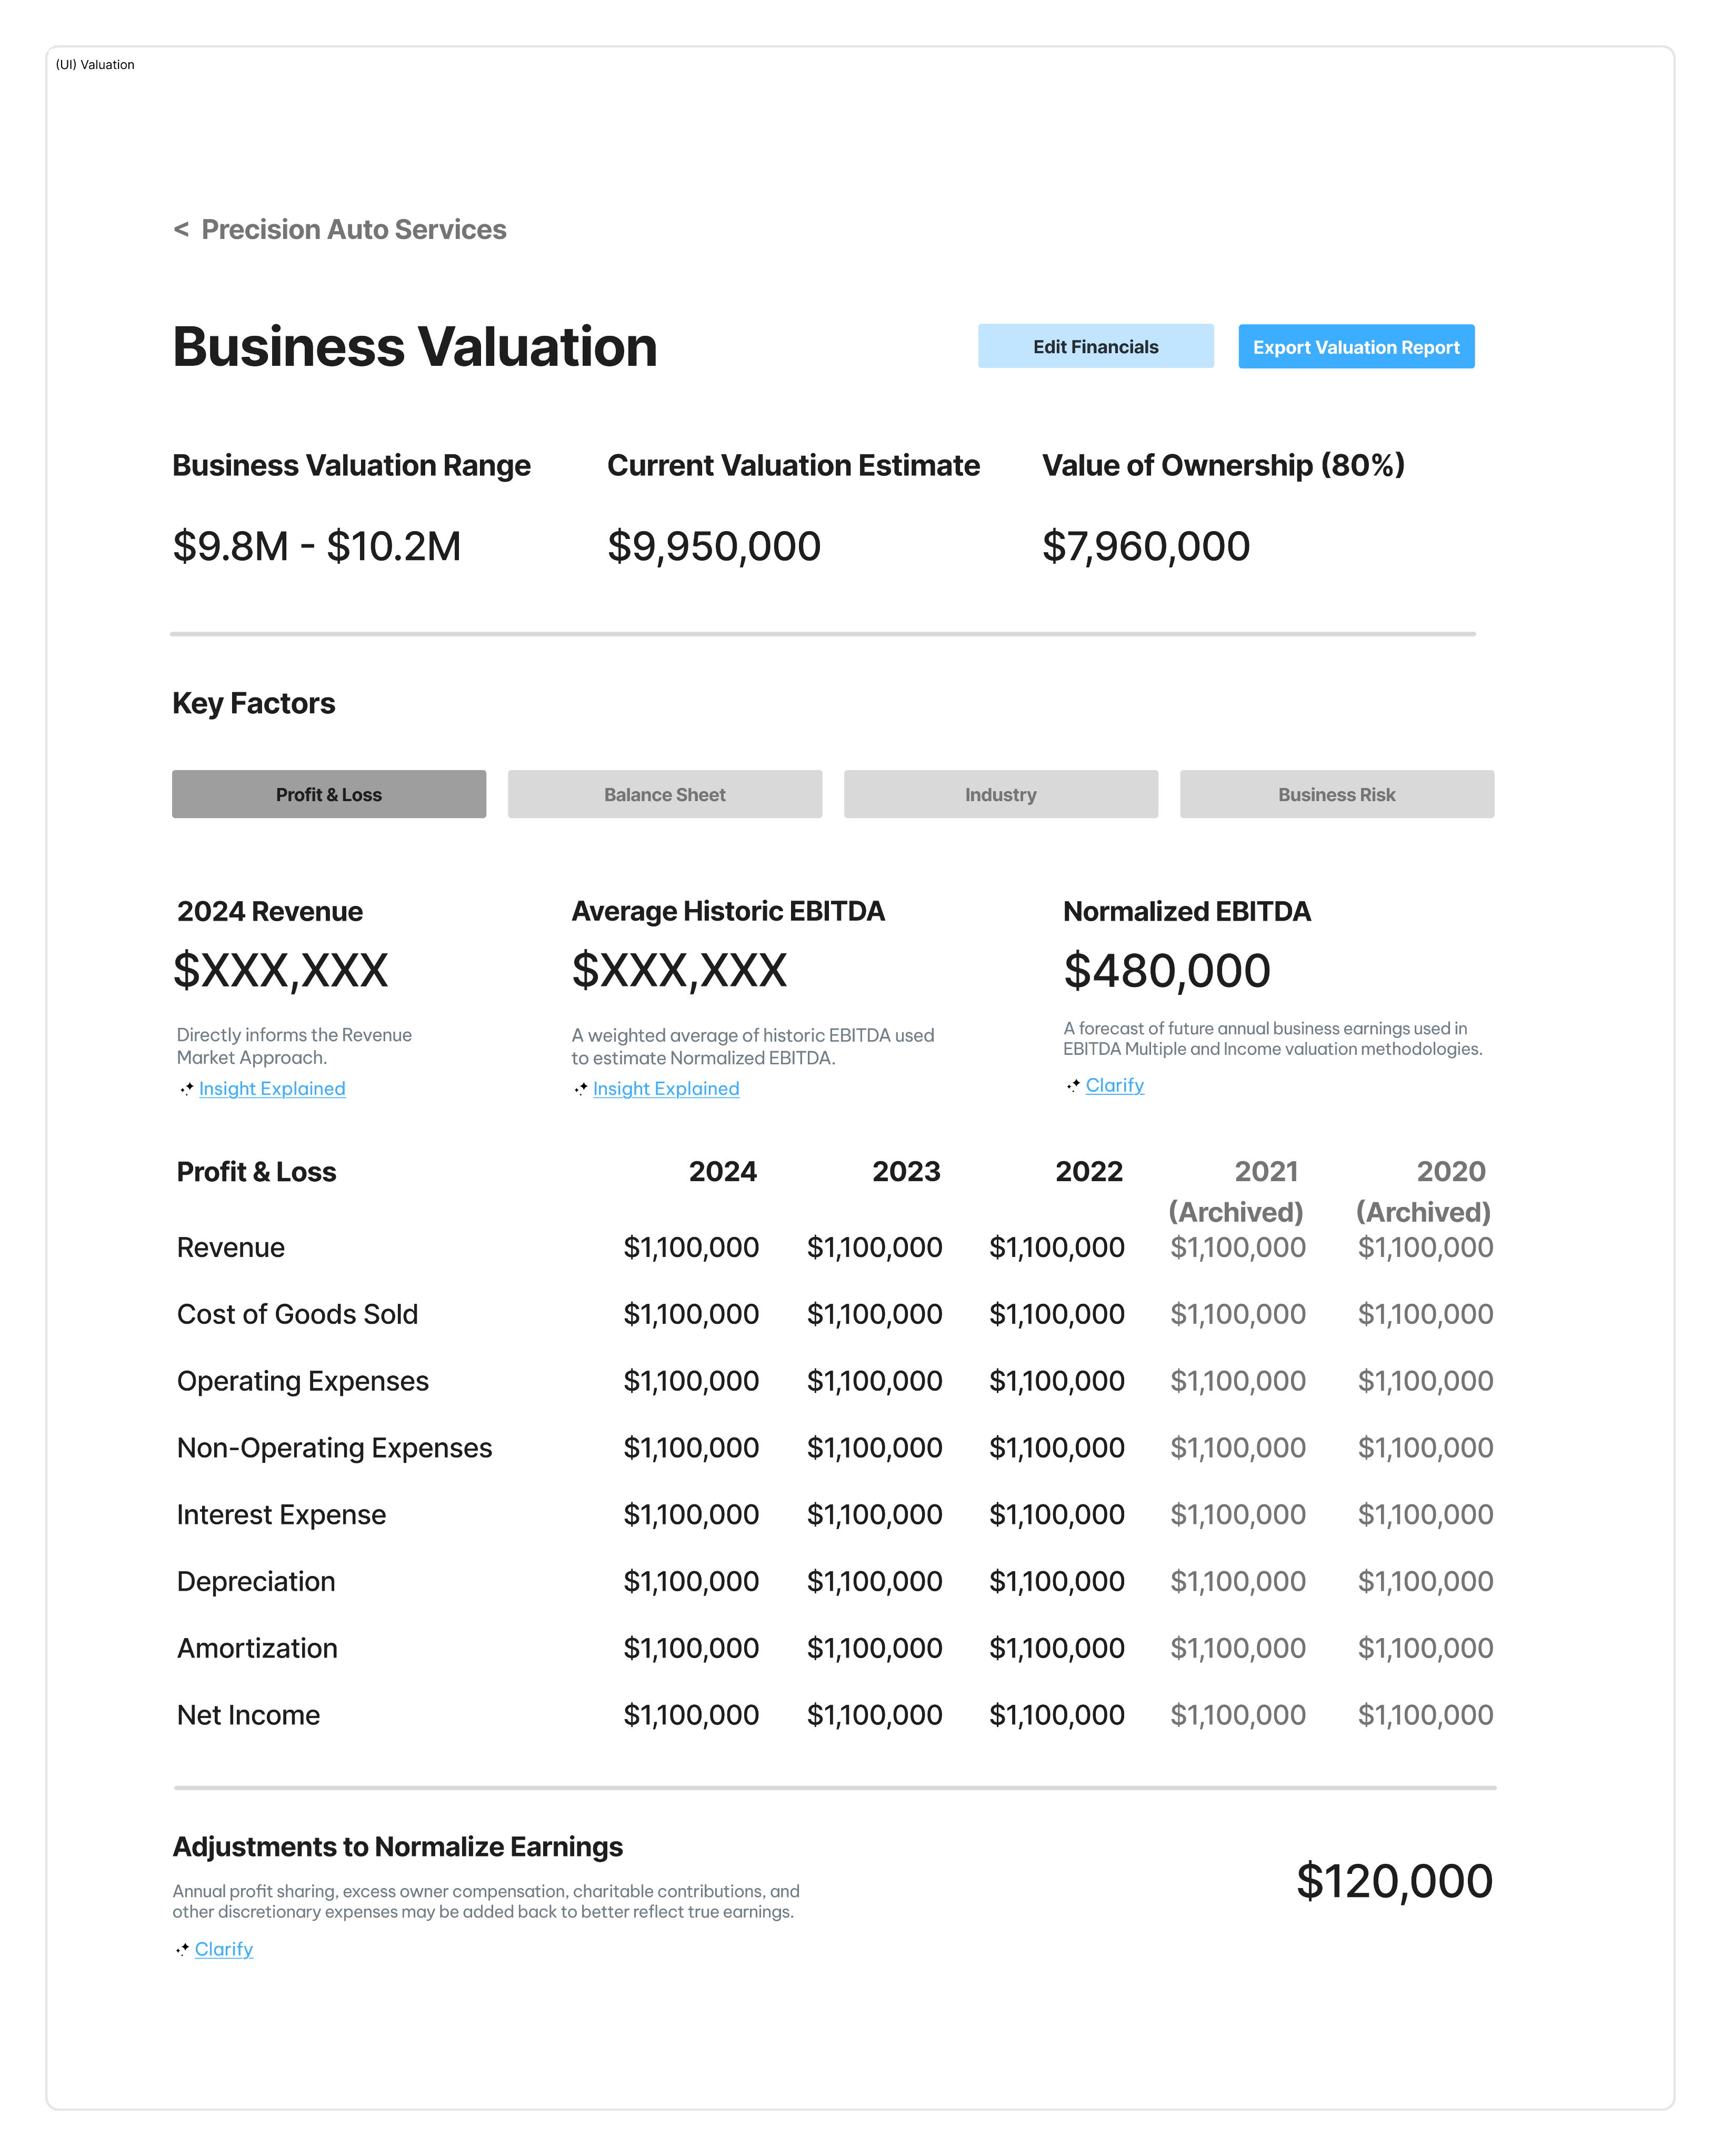
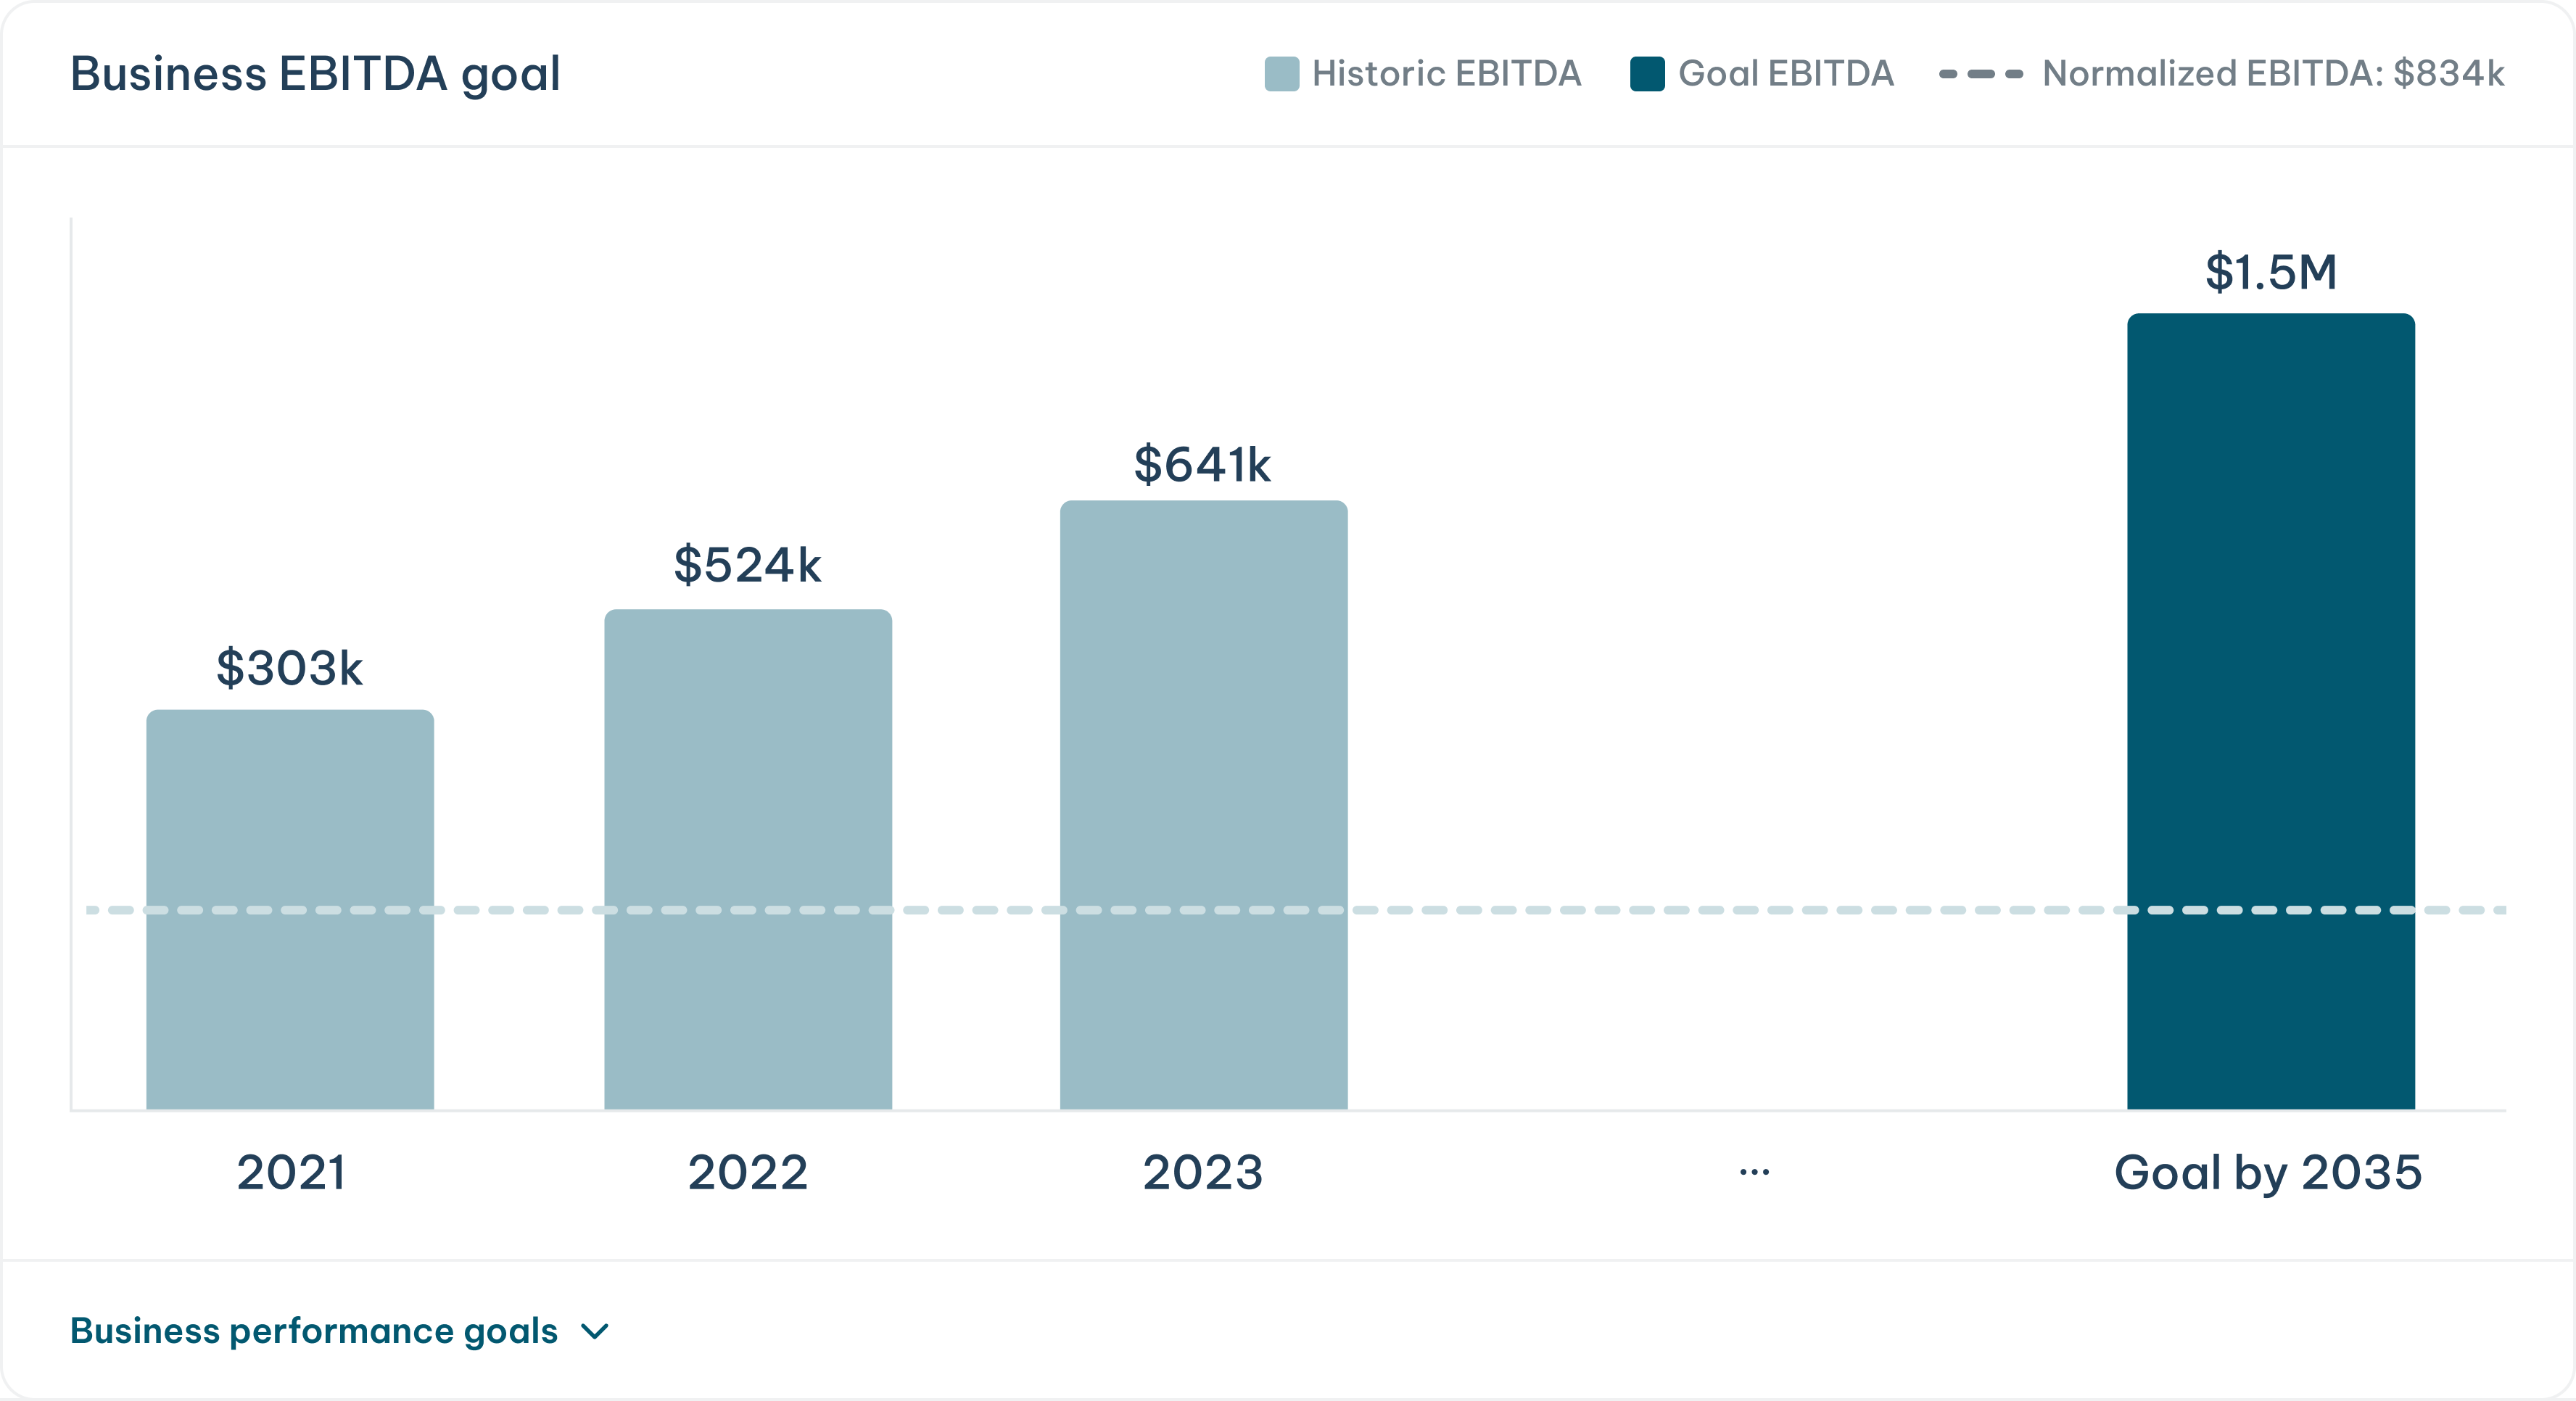
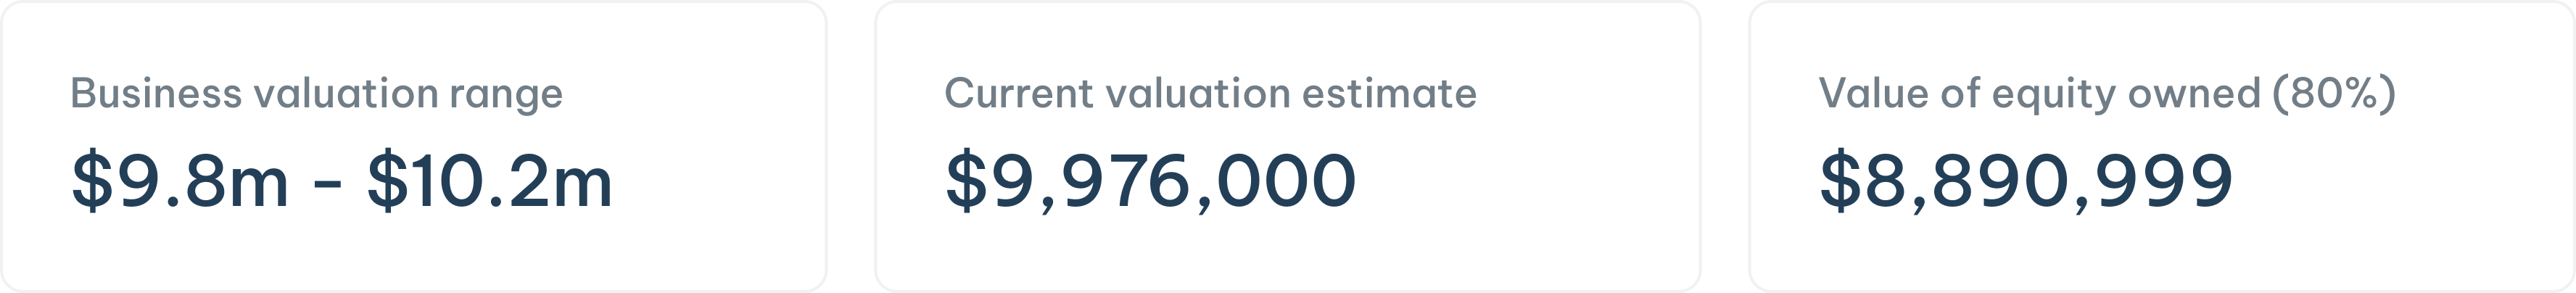
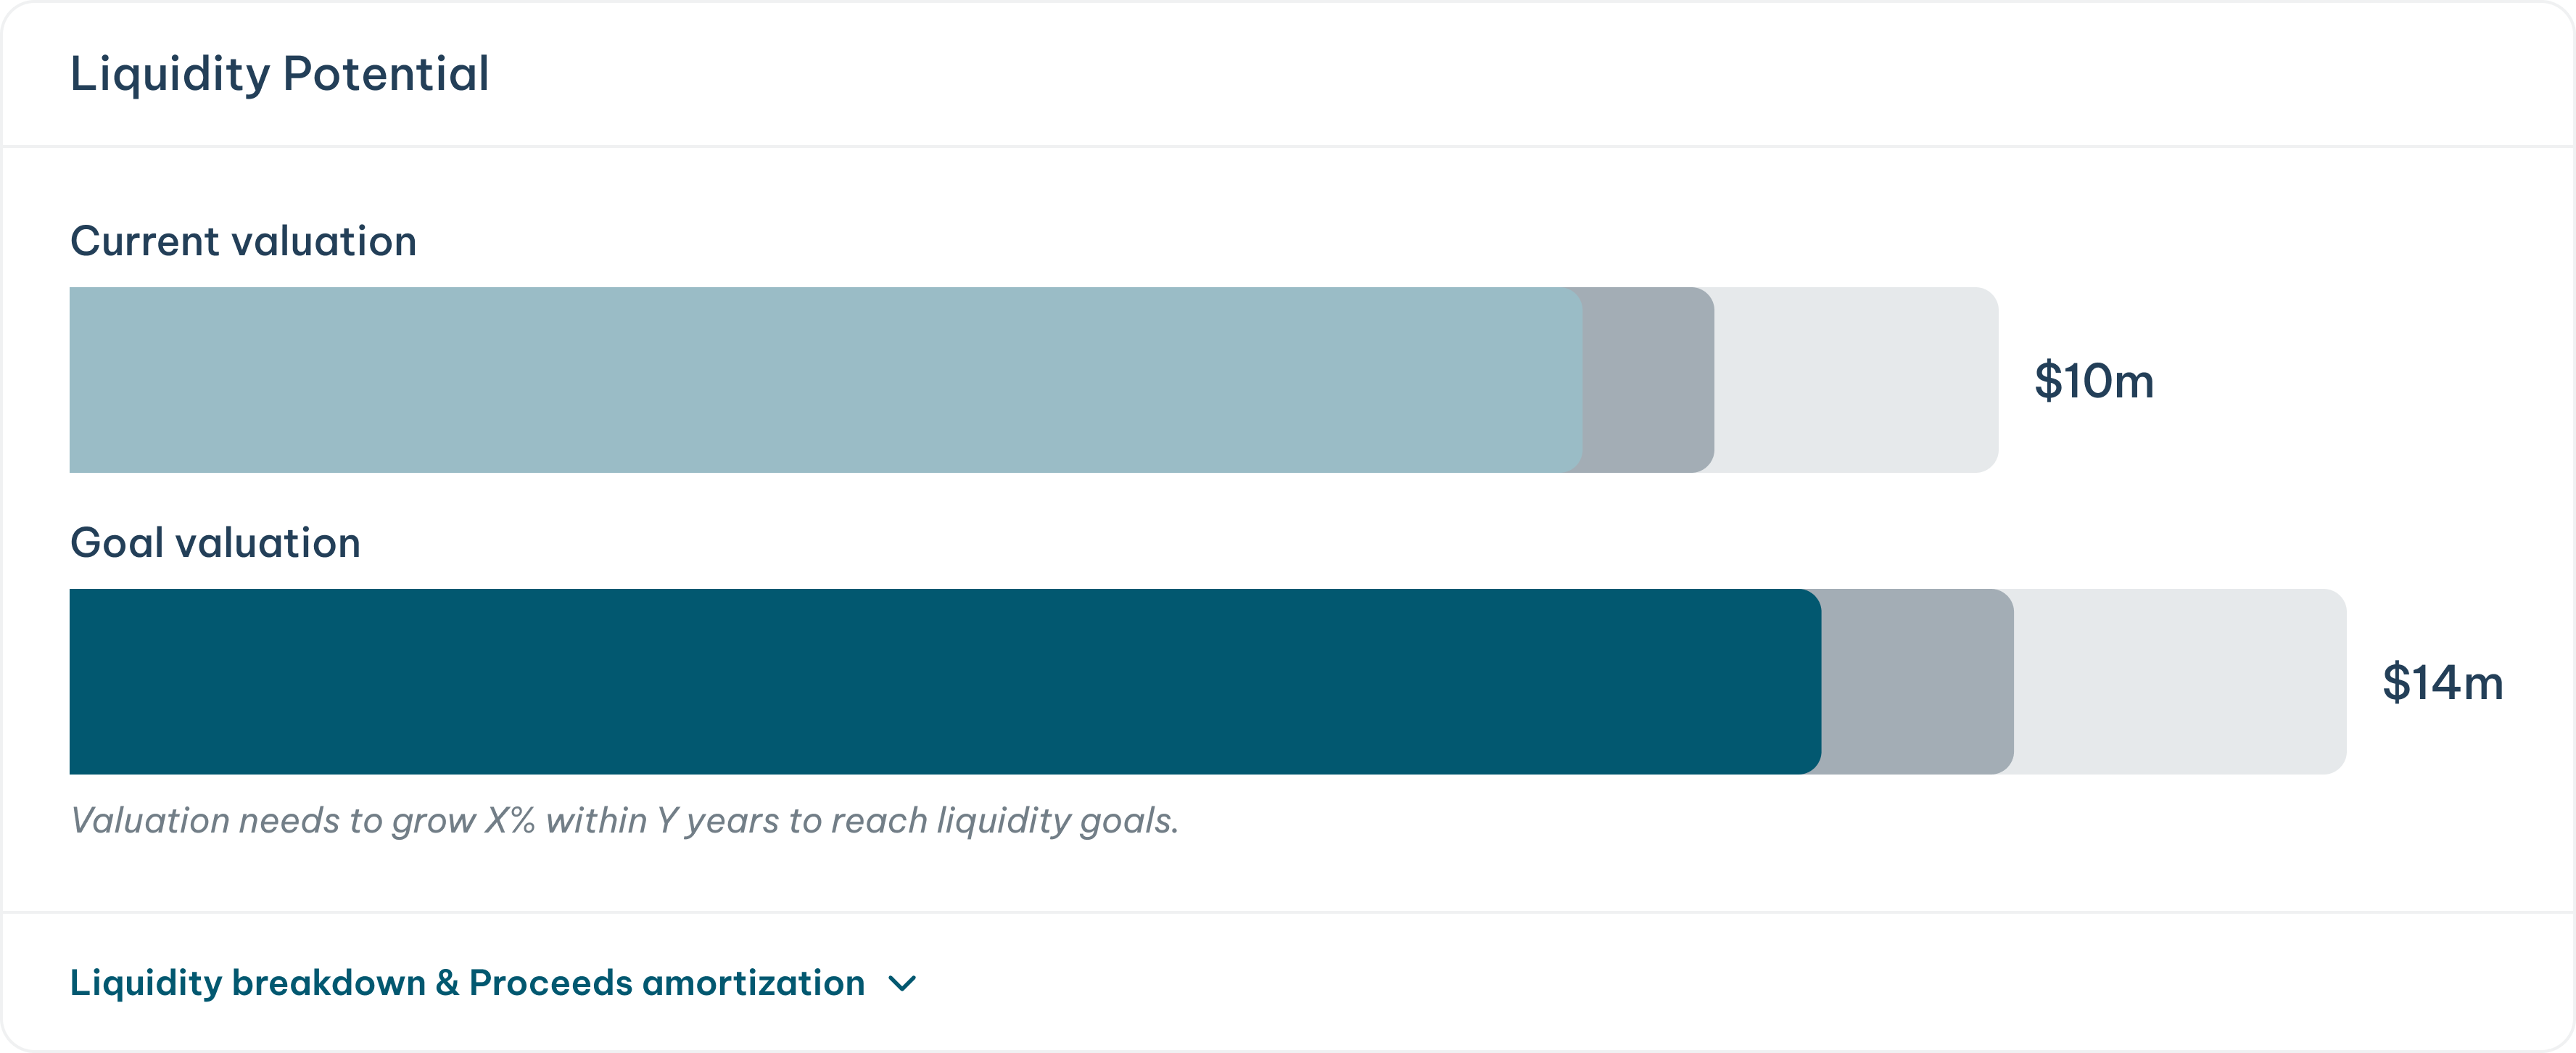
Filled dashboard with generated case
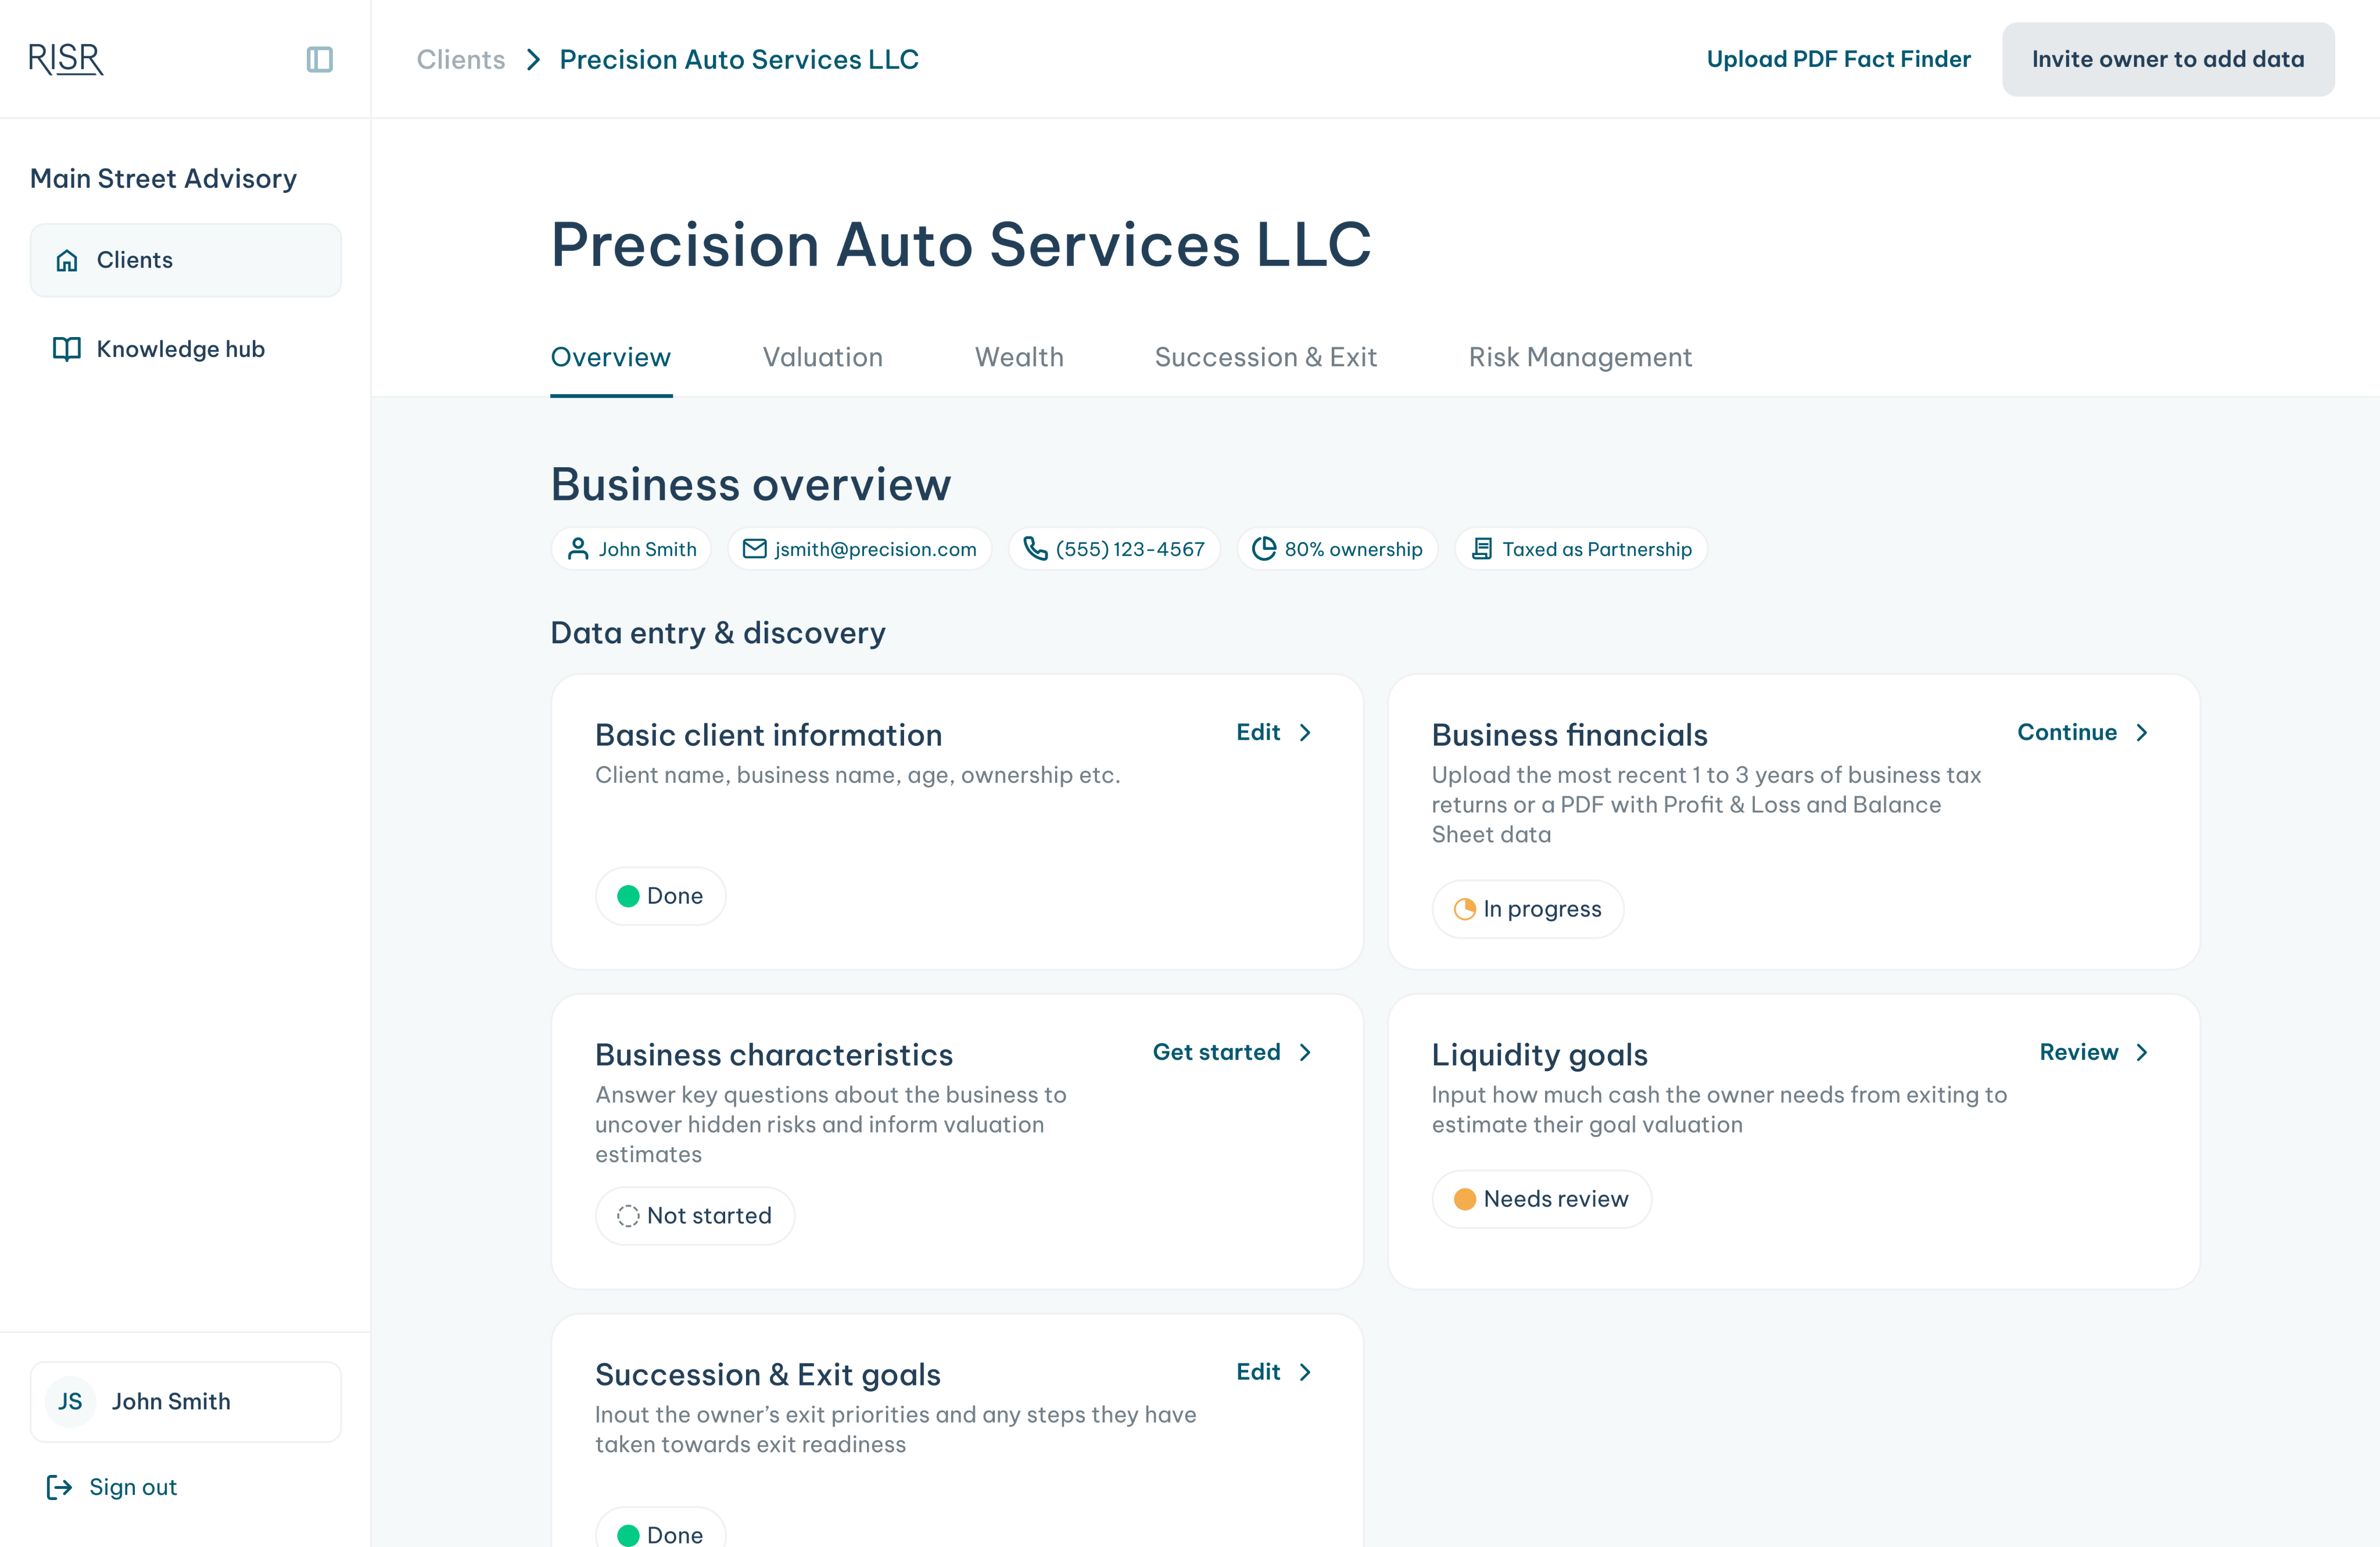
Empty dashboard with modules for initial data capture
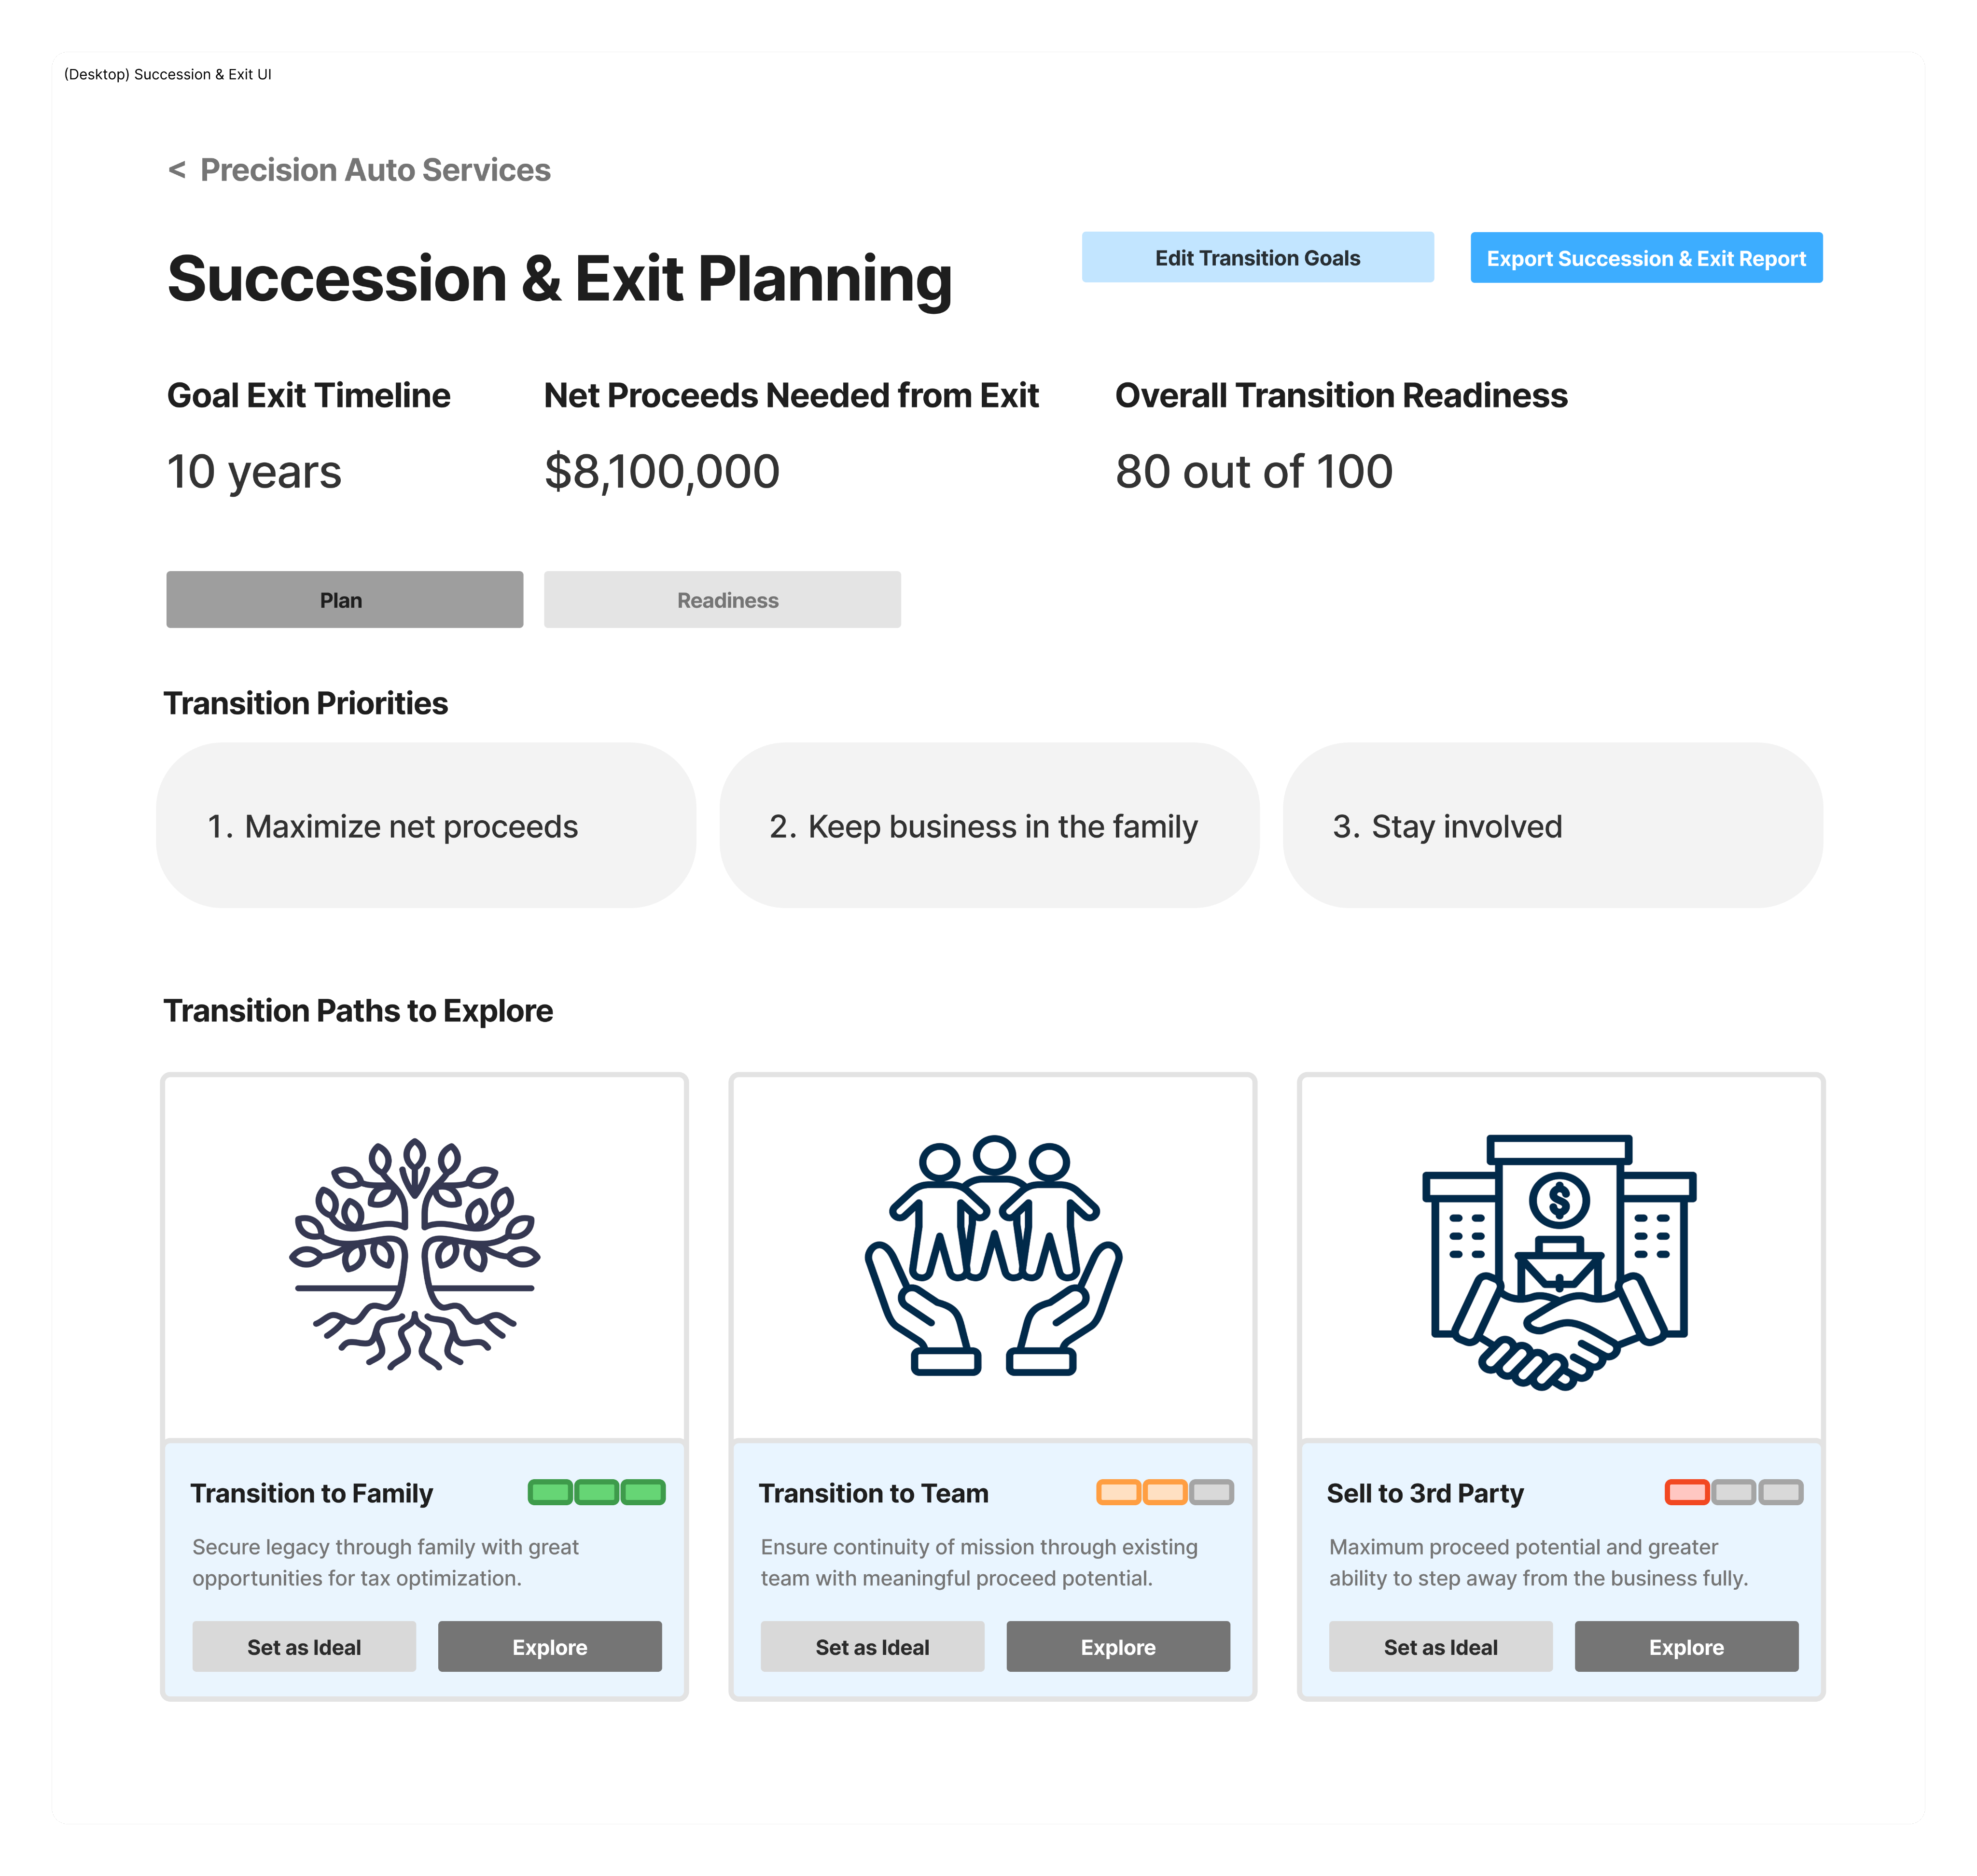
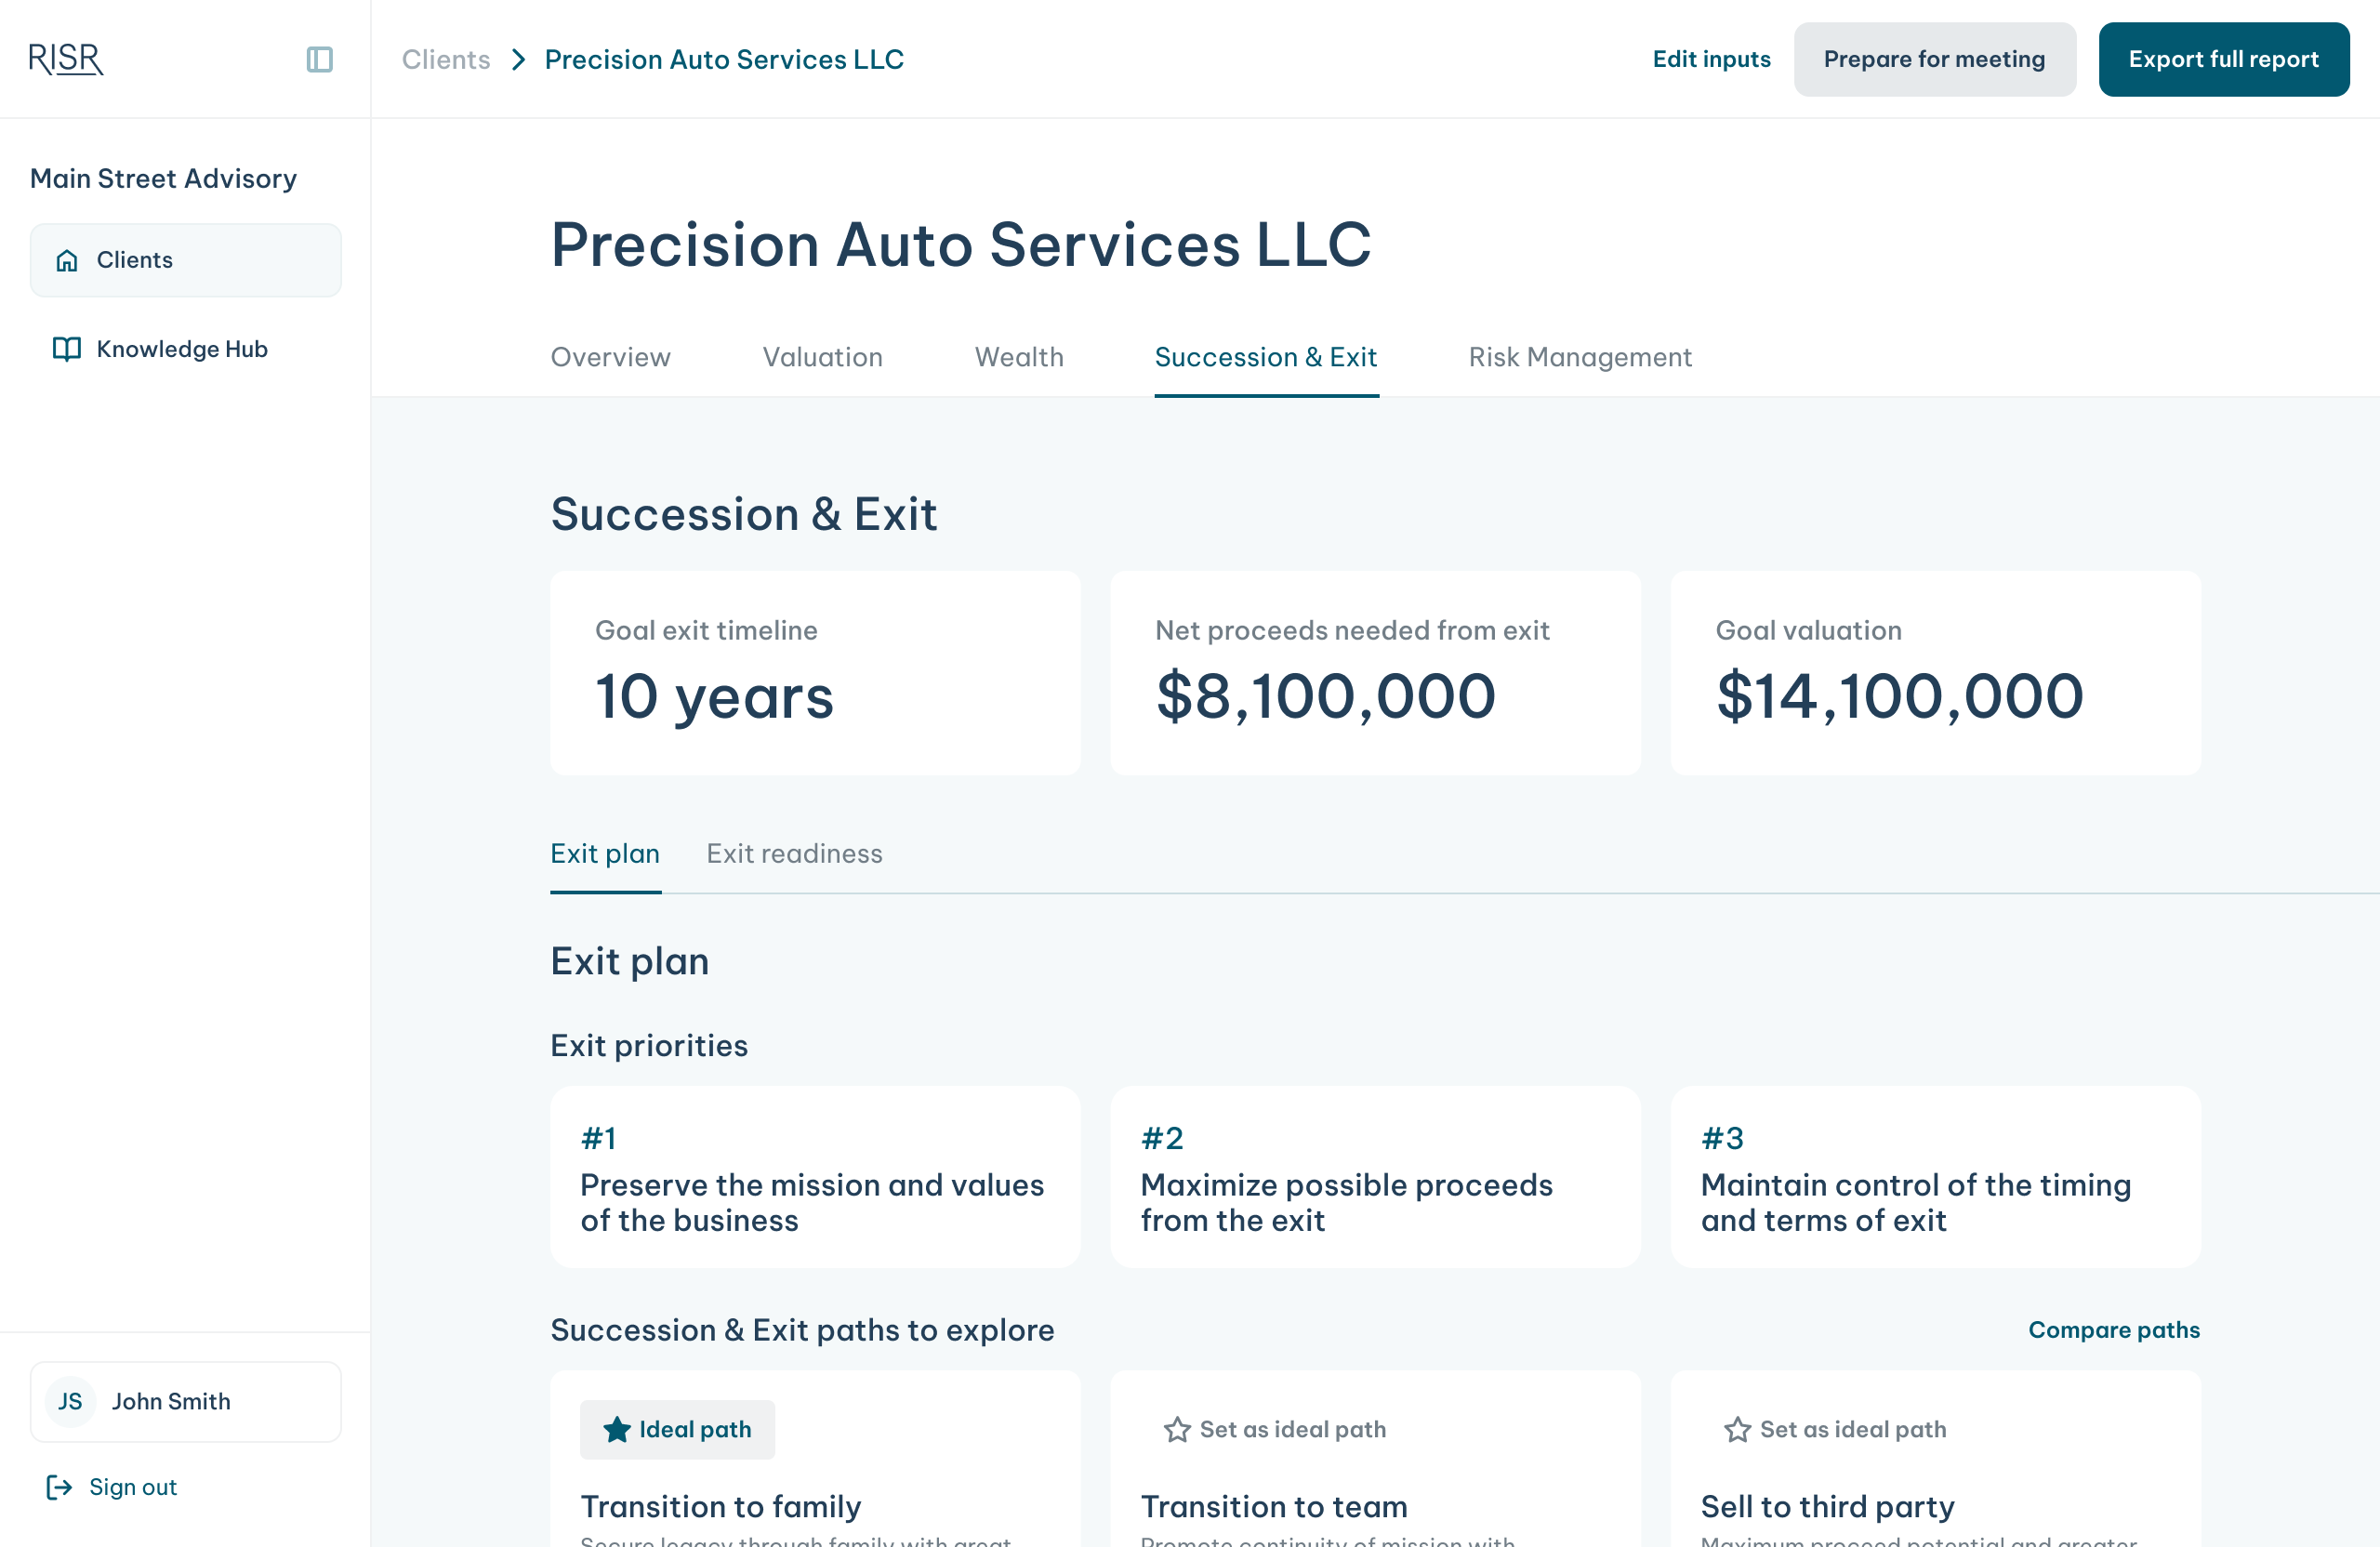
We launched the first succession & exit tool for advisors working with business owner clients.
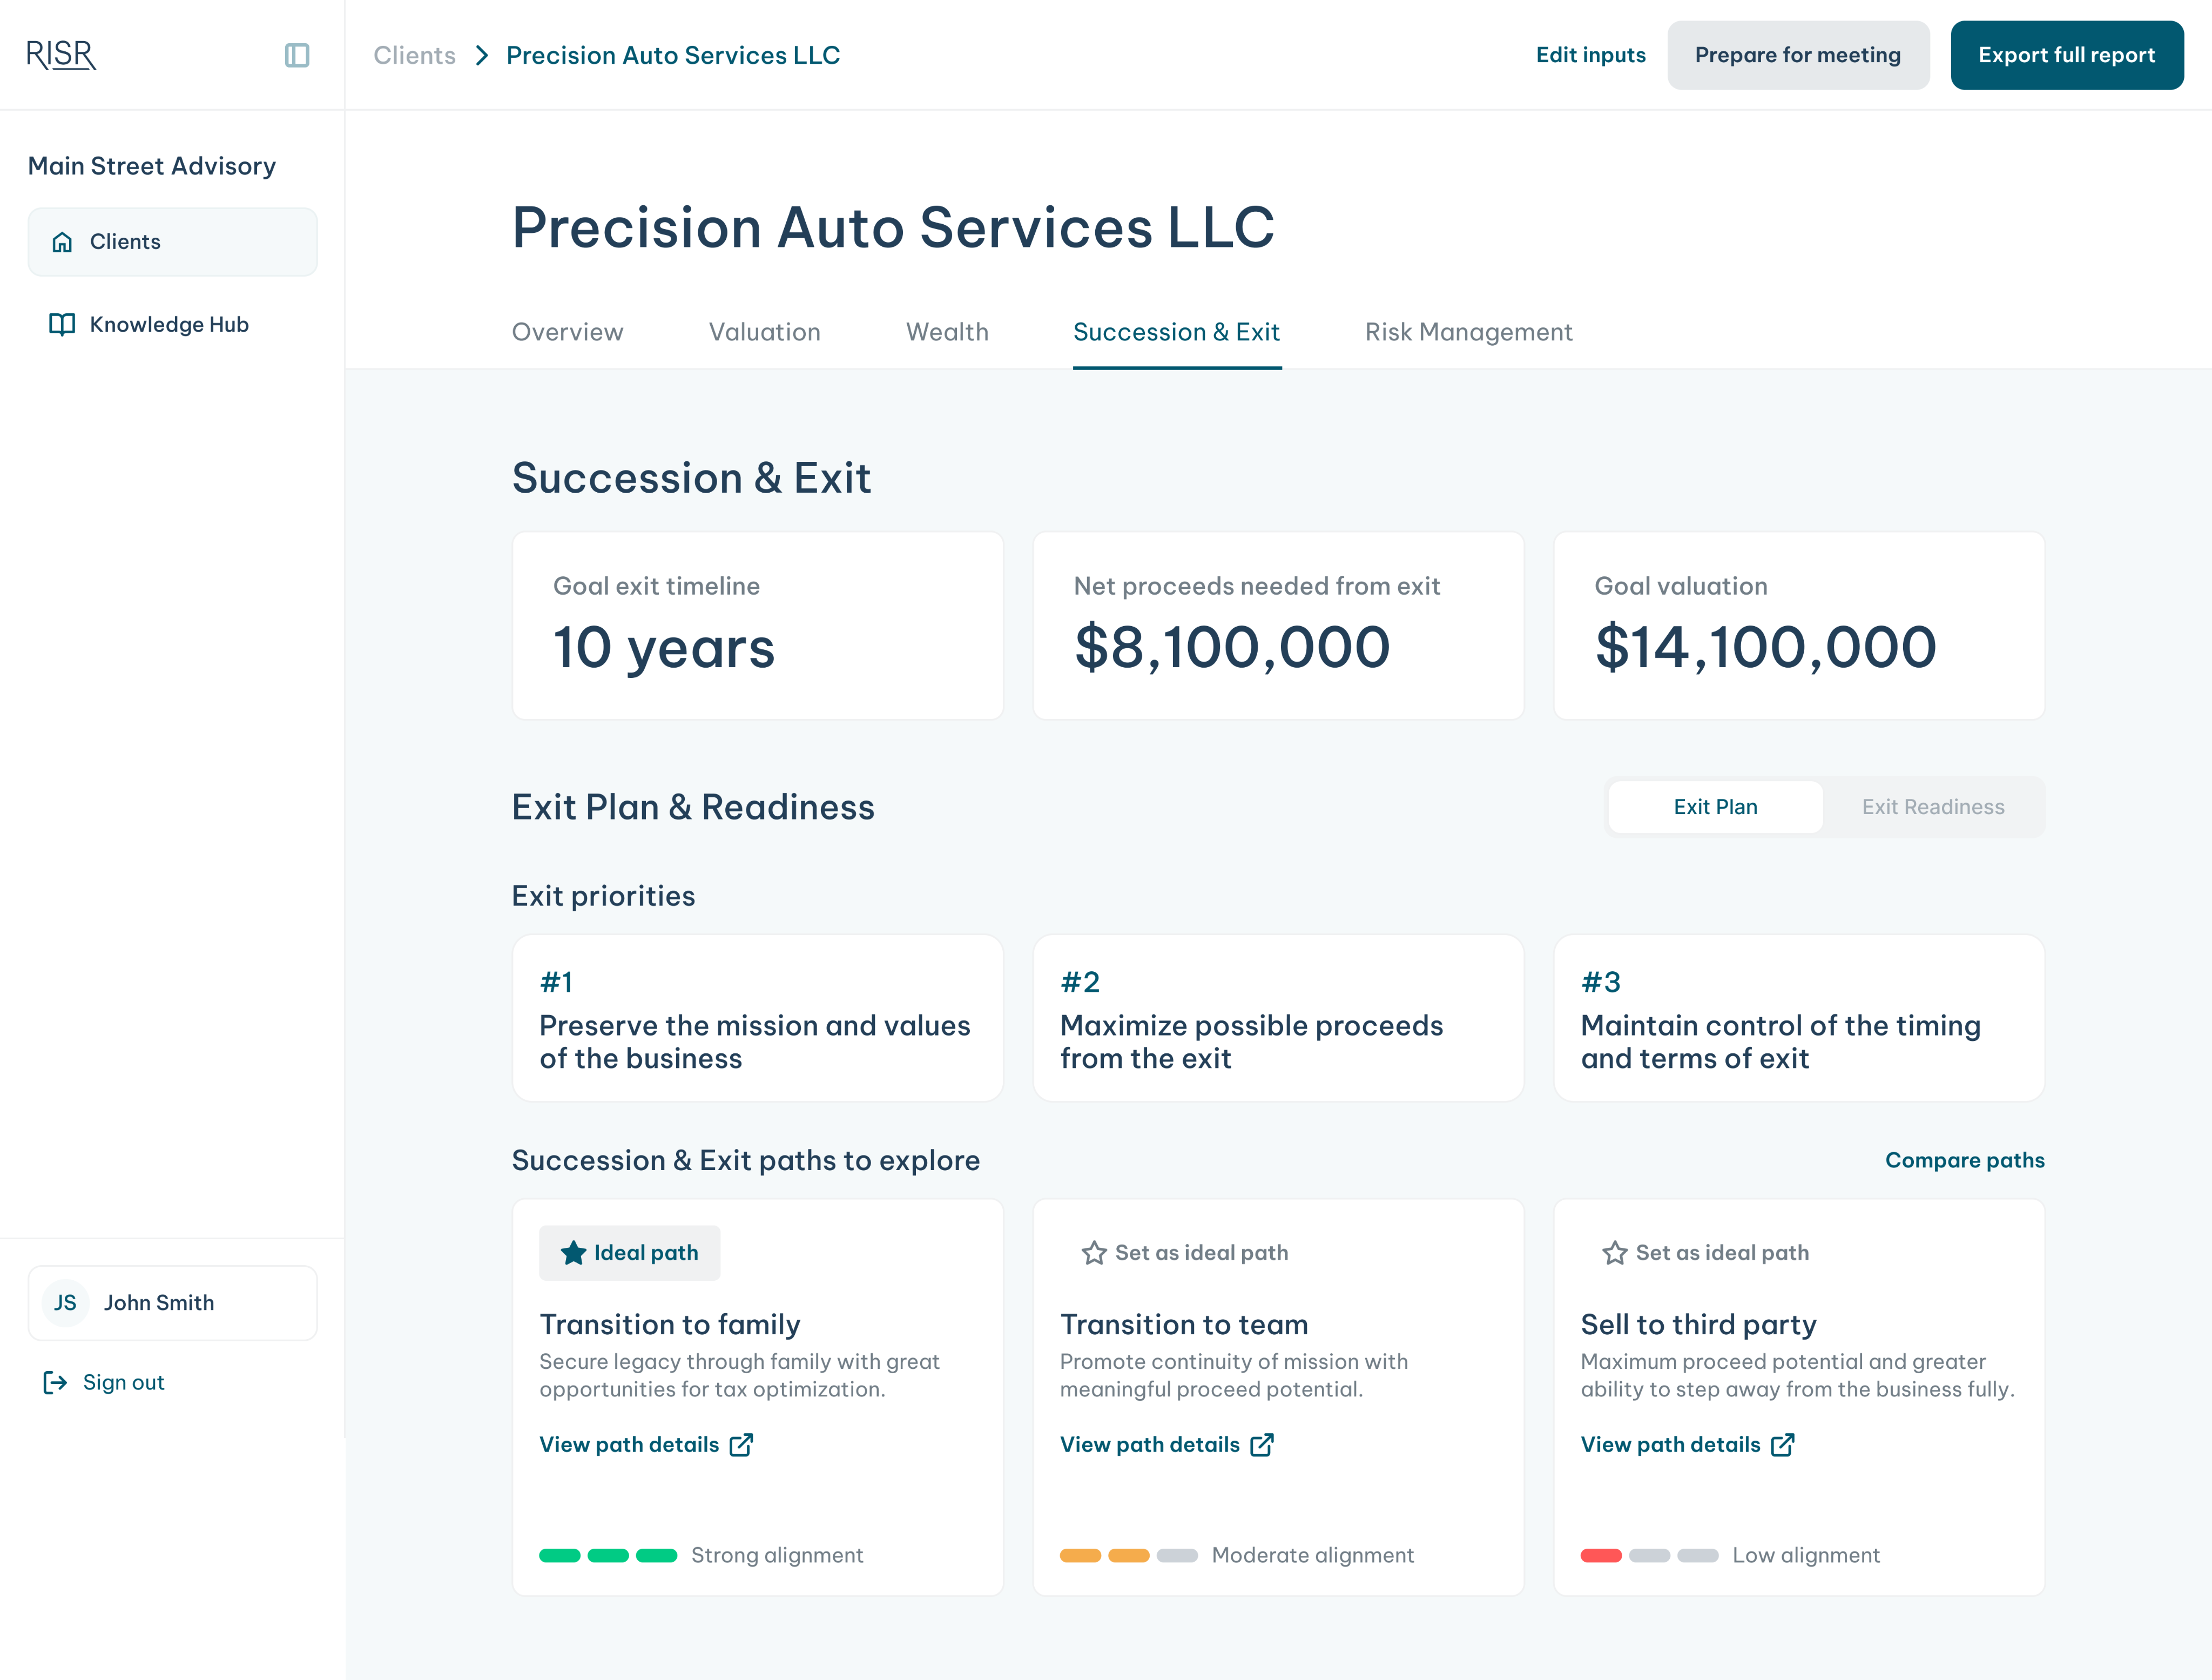
We helped advisors guide clients towards their ideal exit plans based on their priorities.
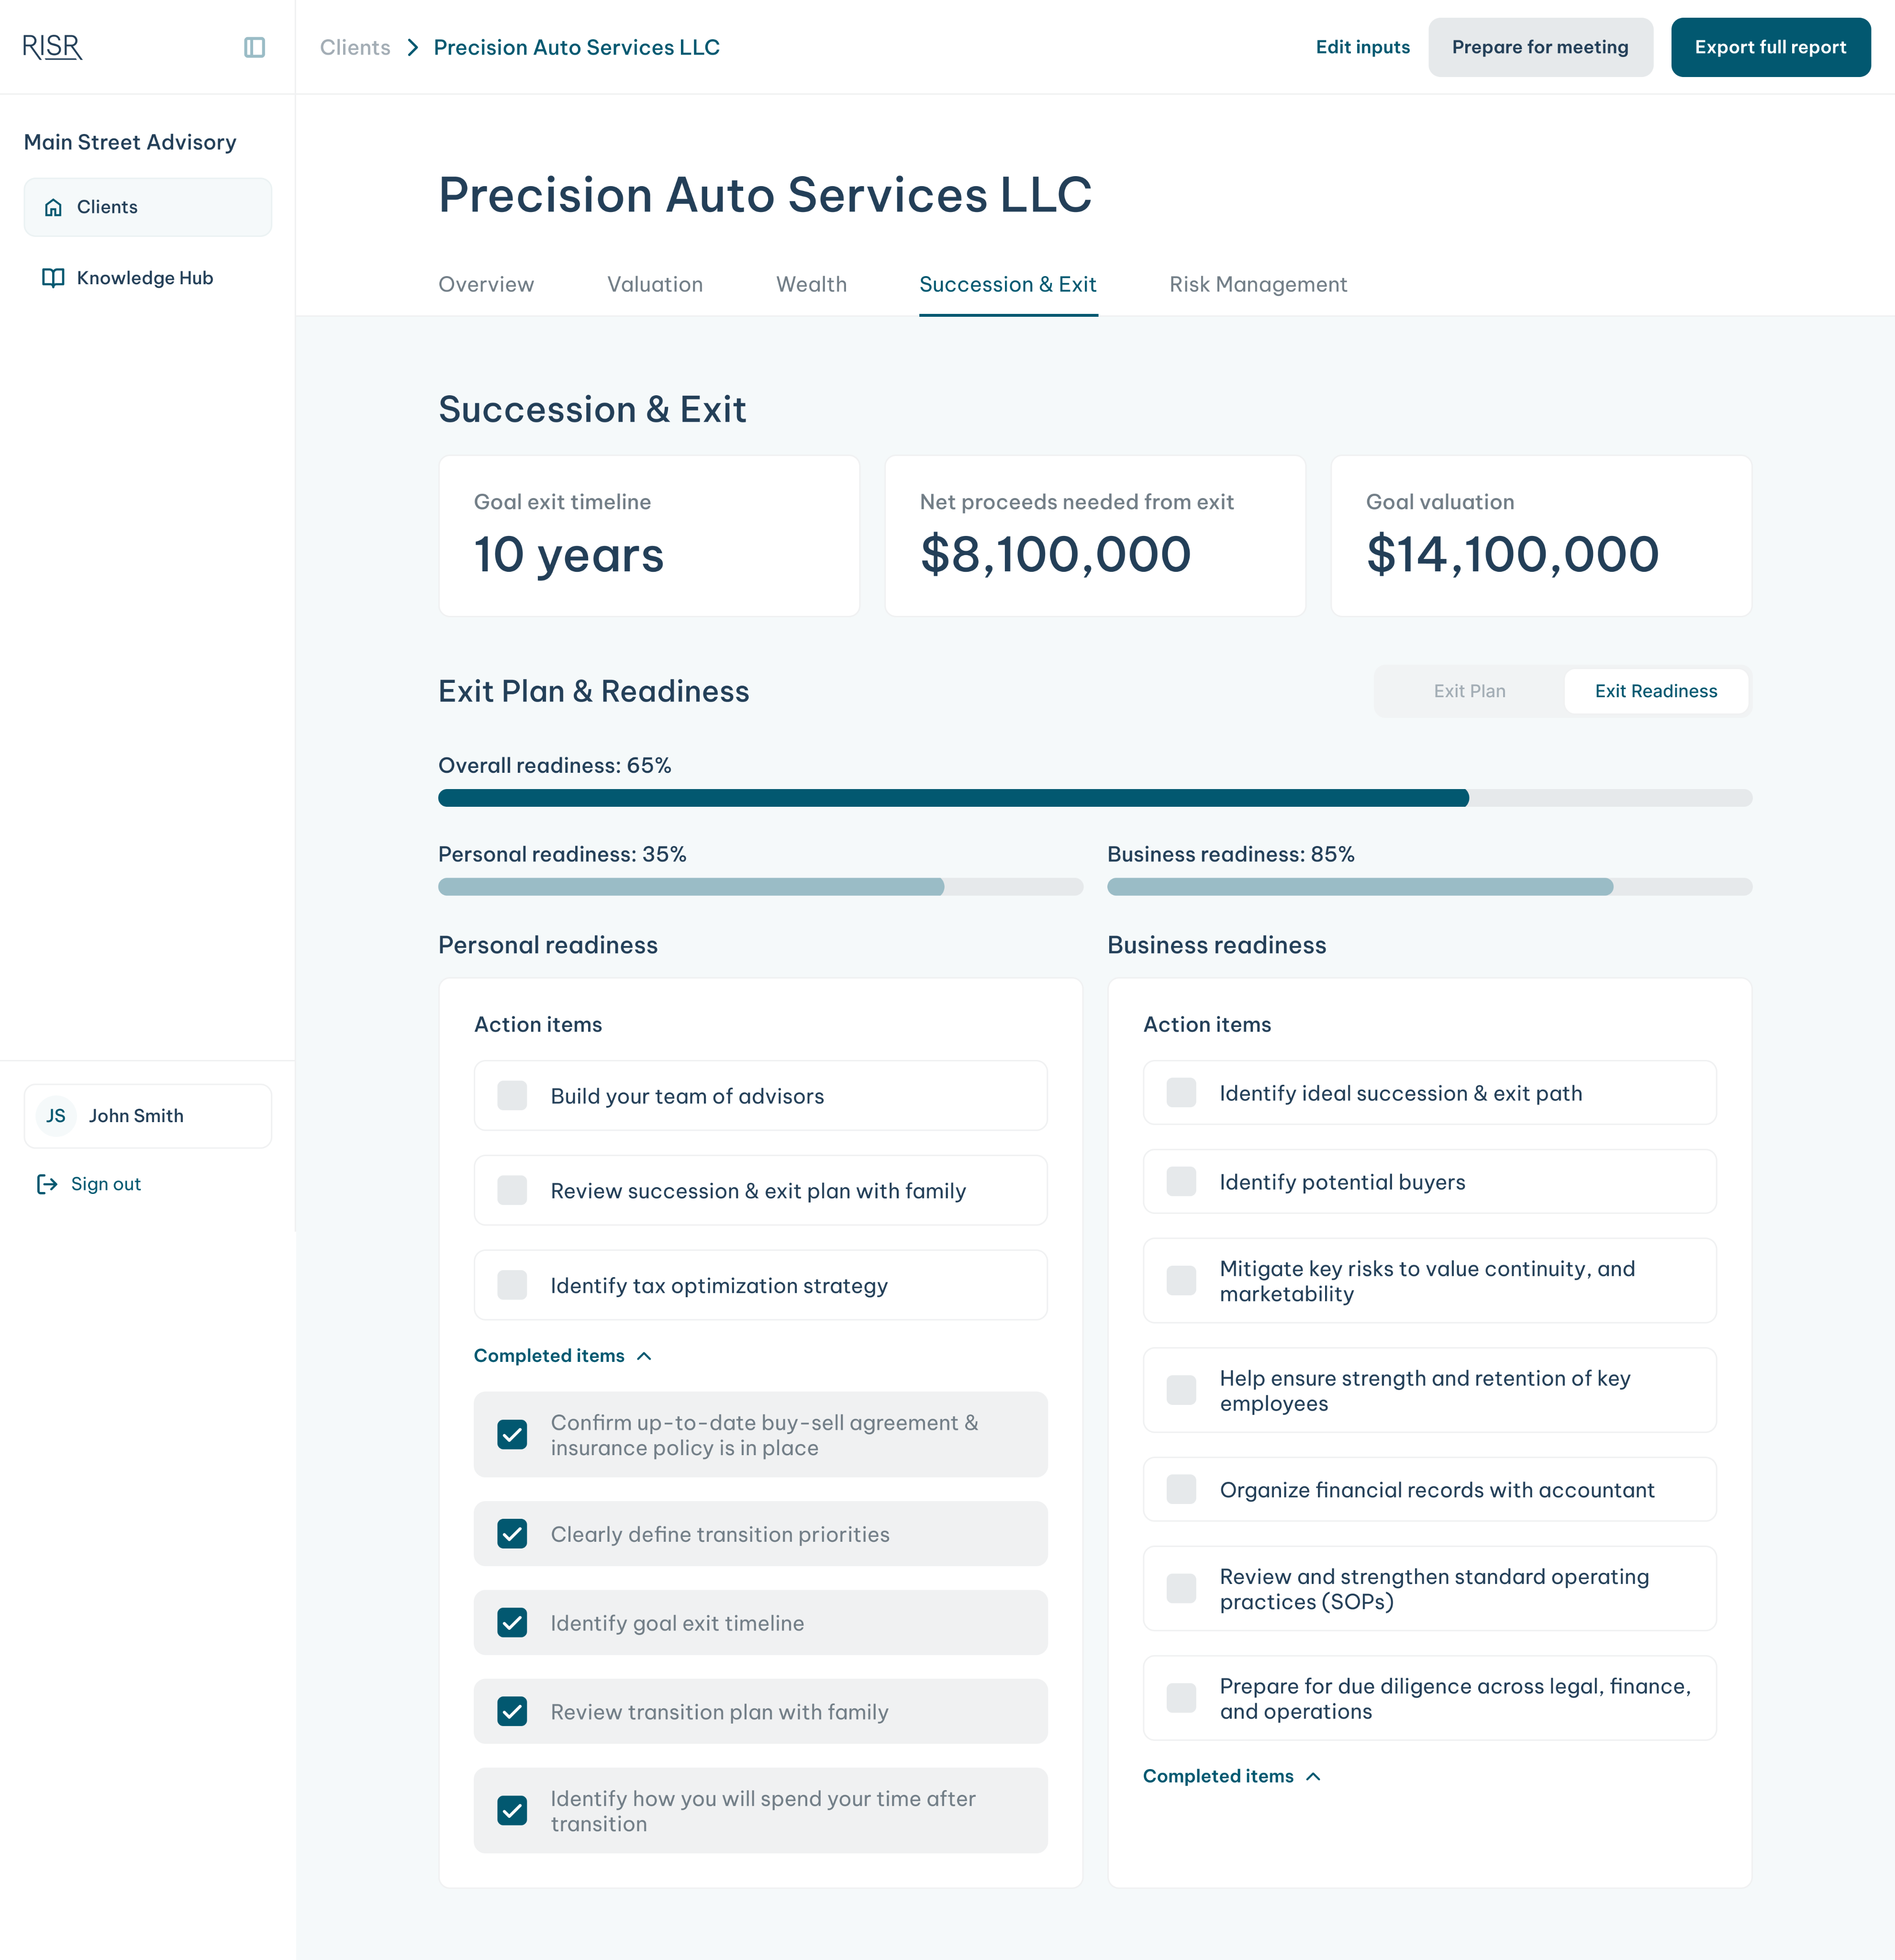
We gave advisors a checklist informed by power users to benchmark their clients against.
In one iteration, we increased surface area 4x using data we already had.
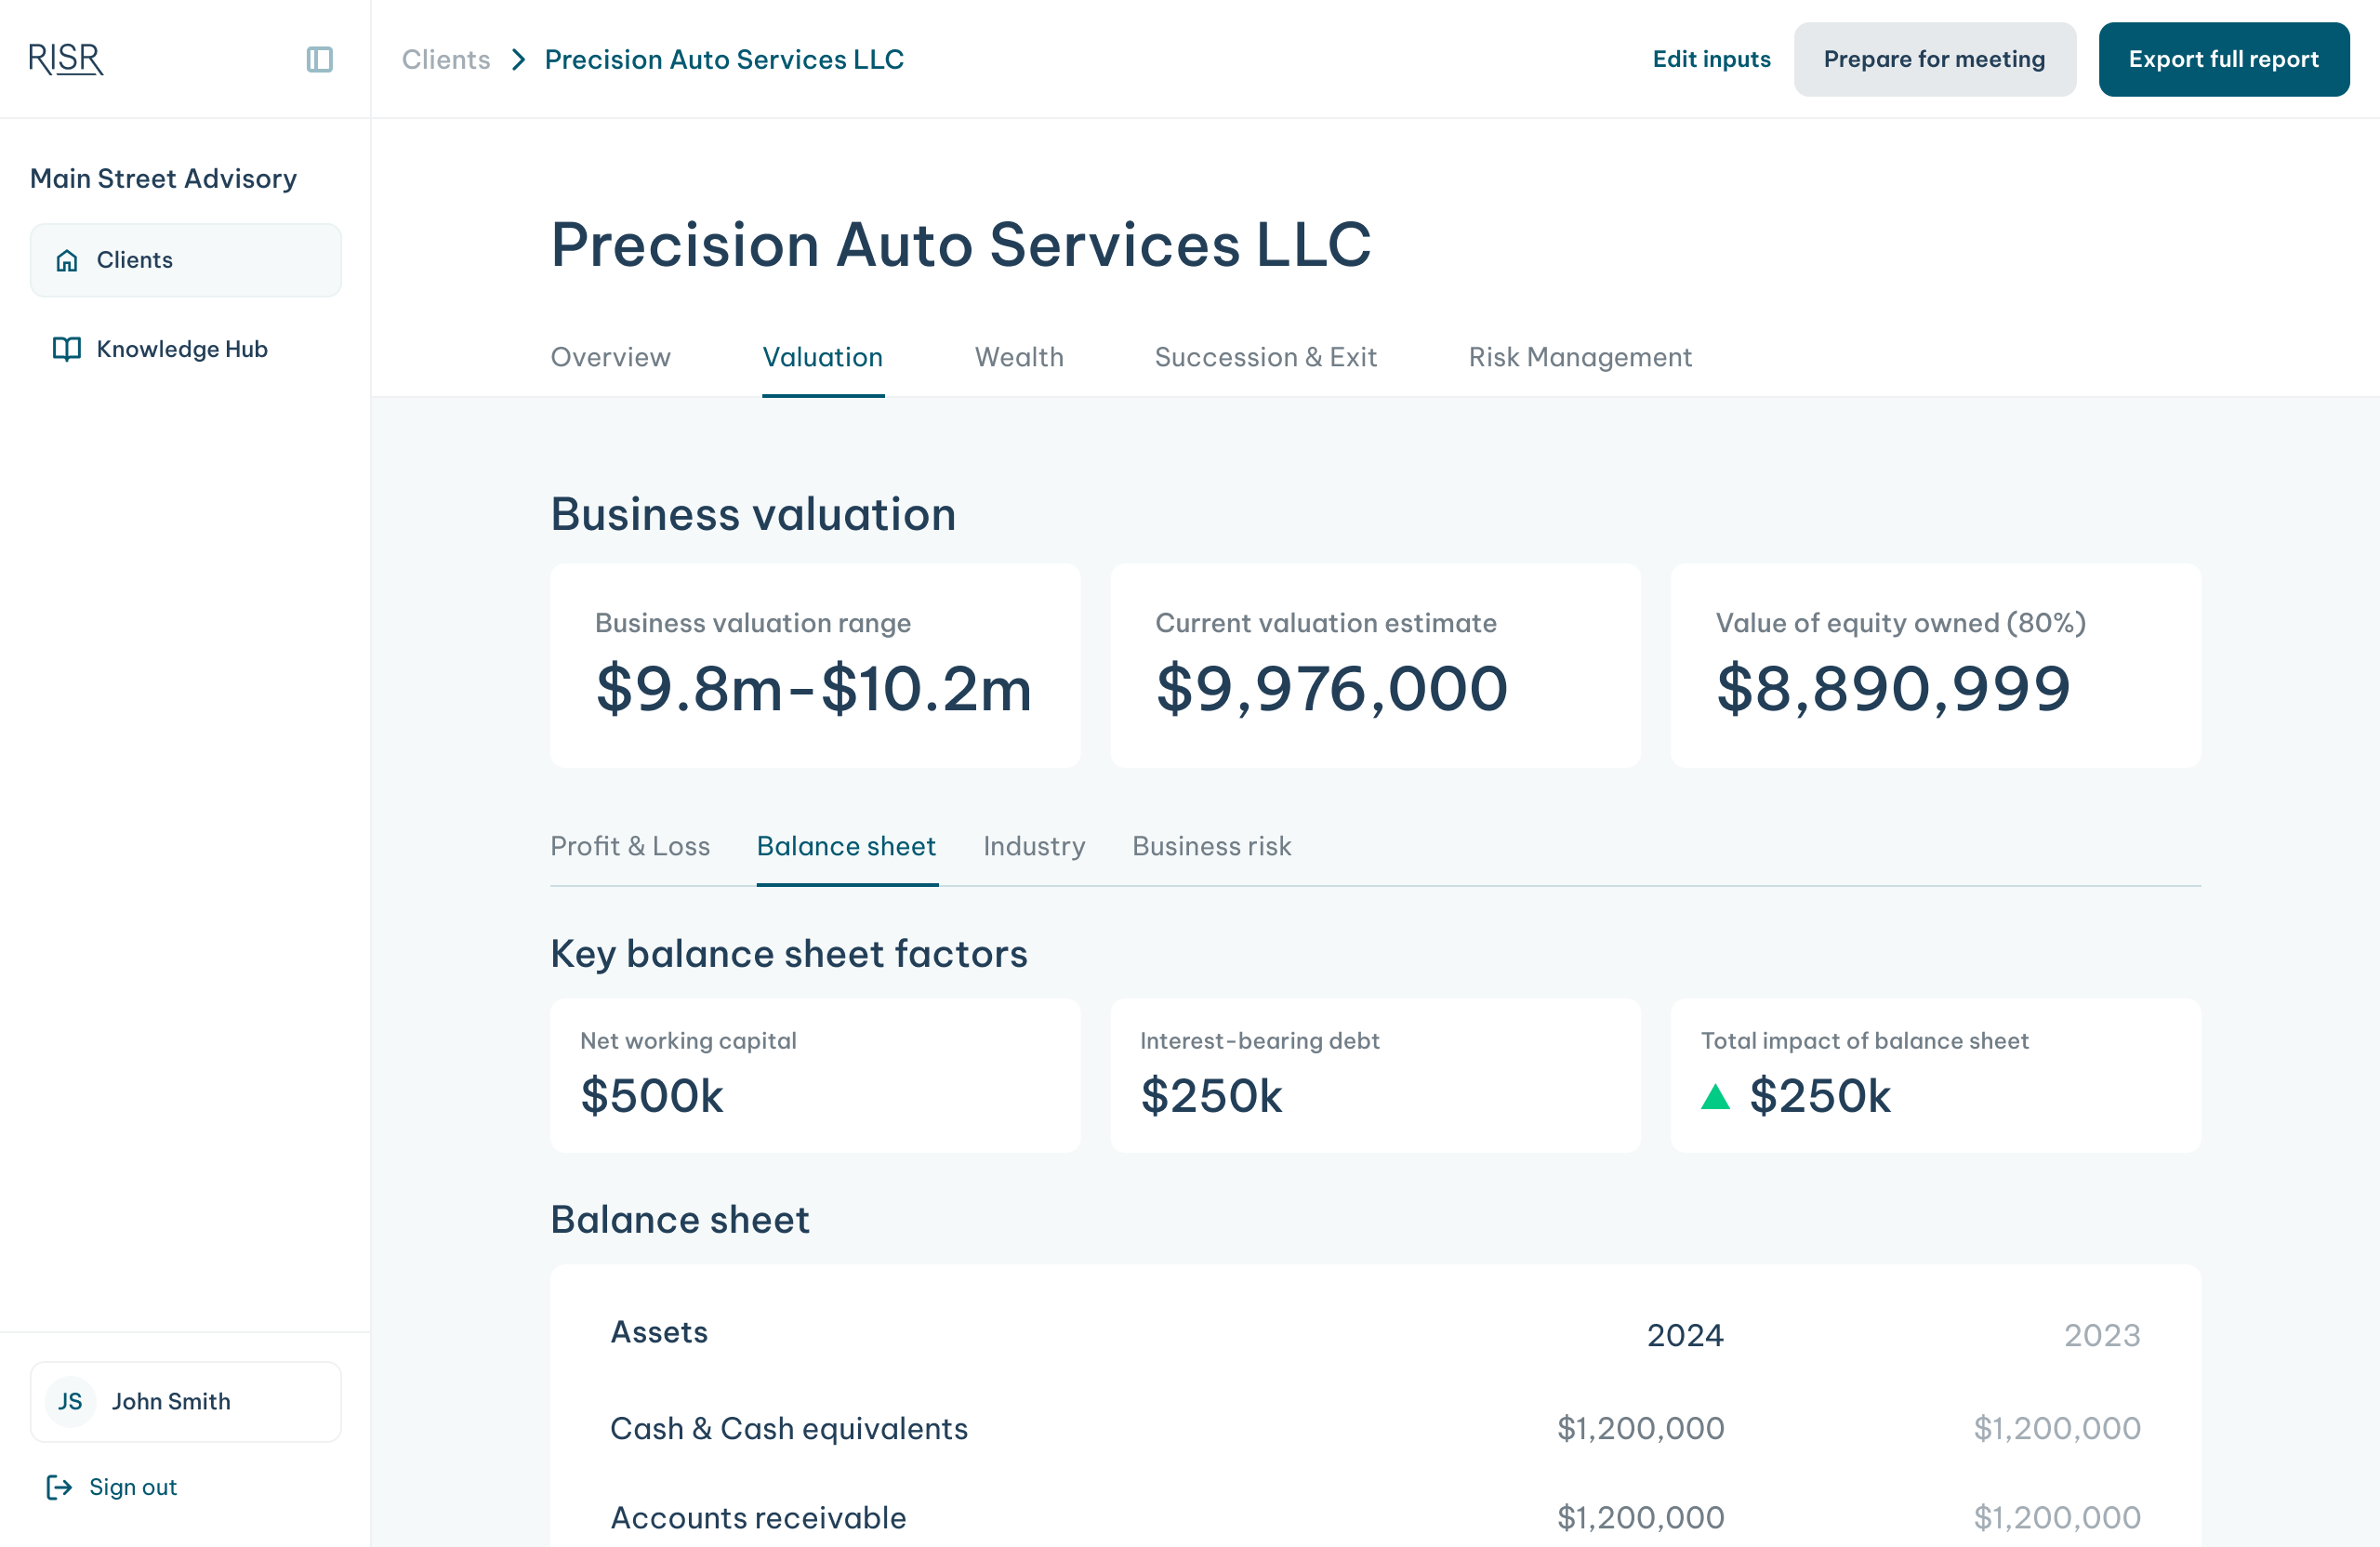

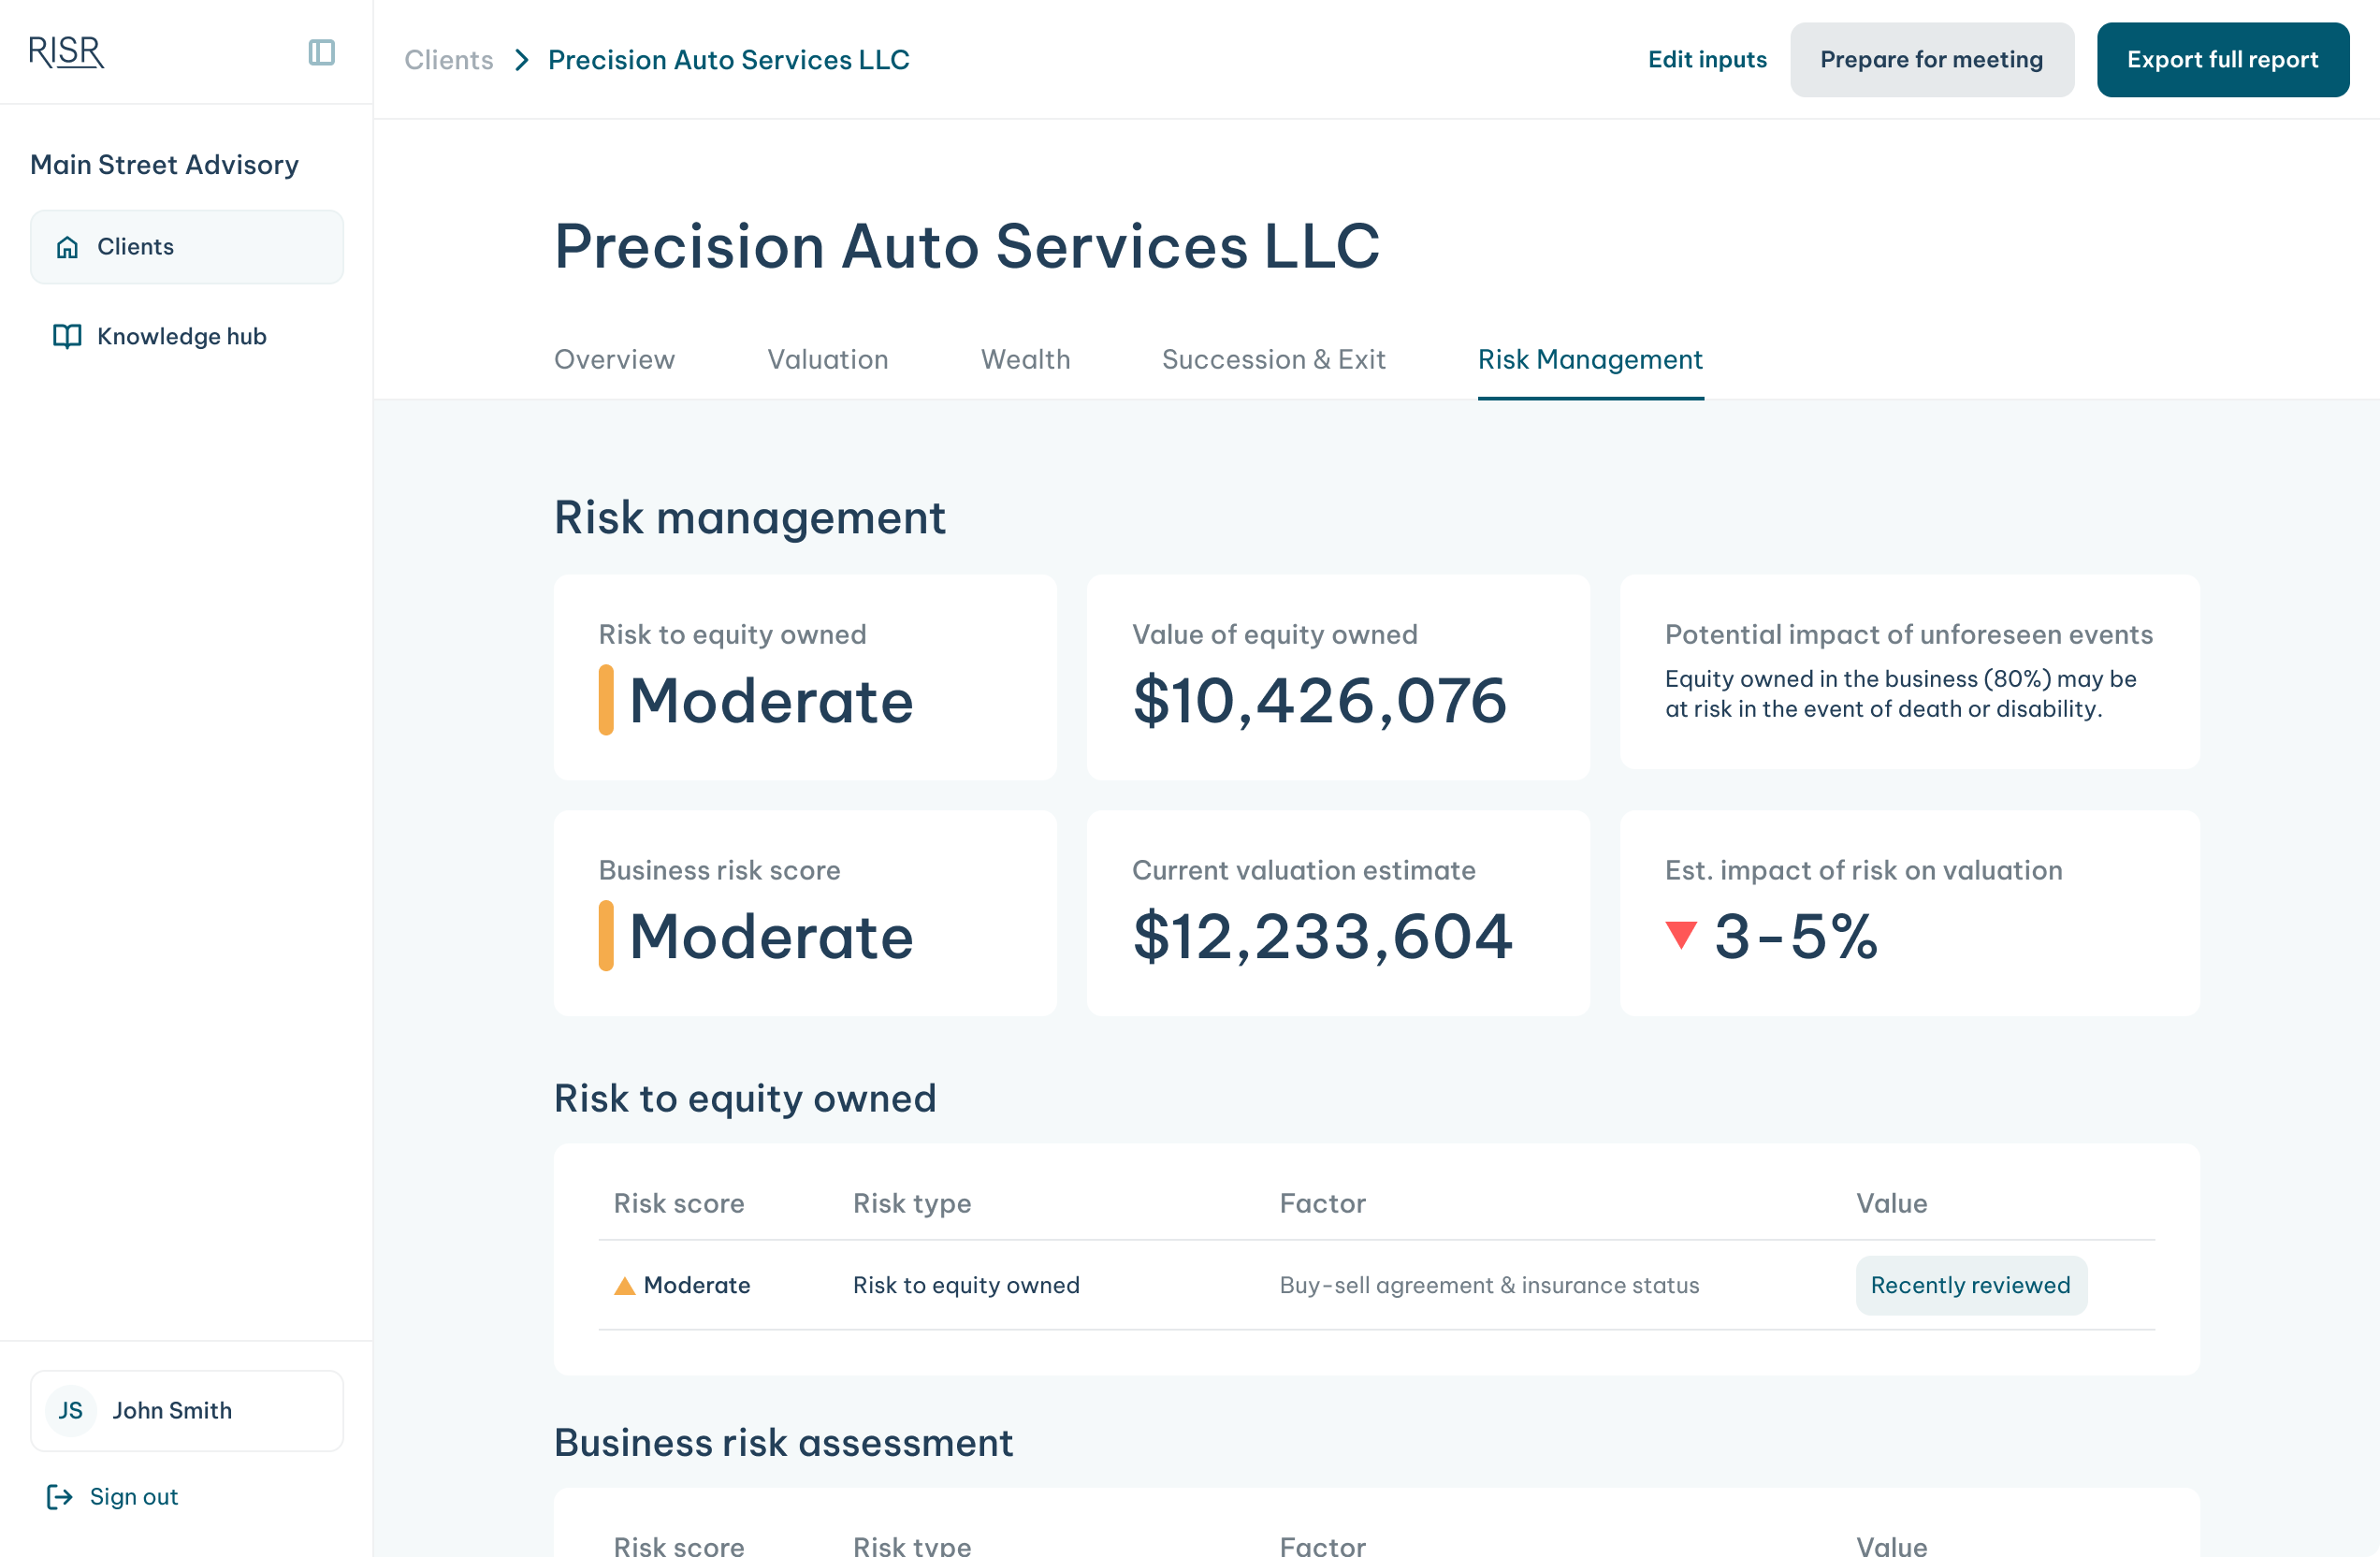
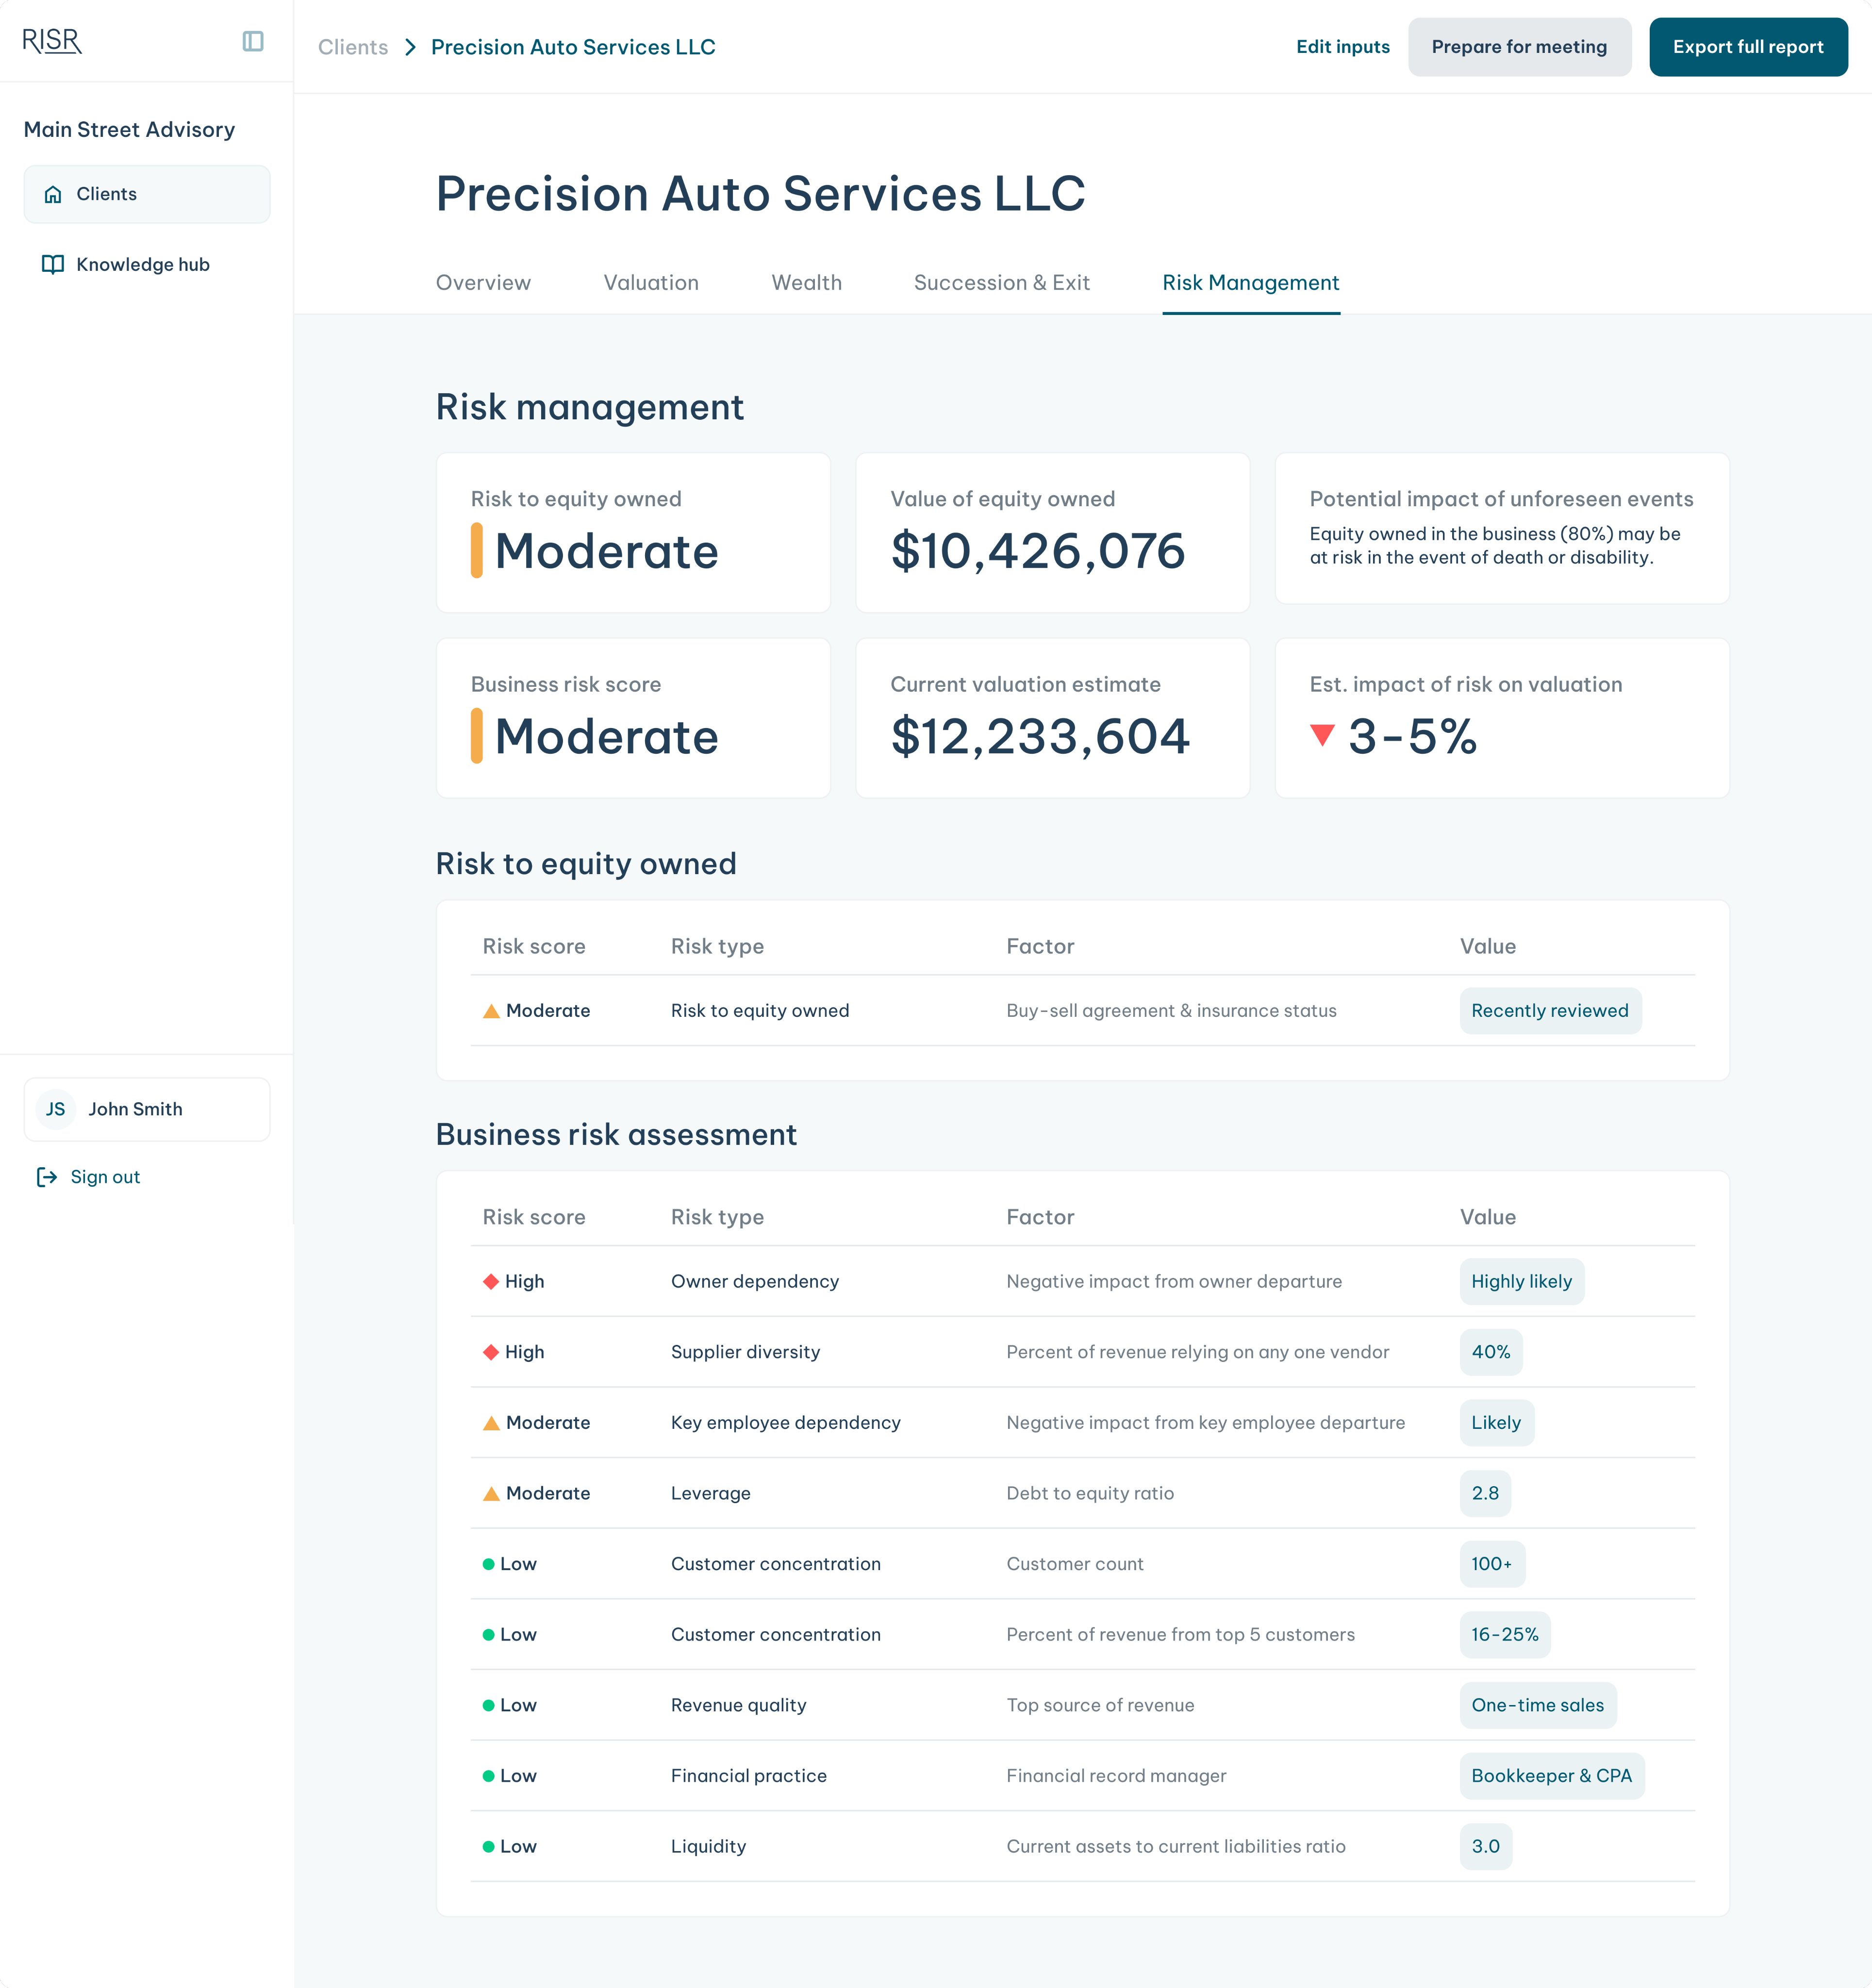
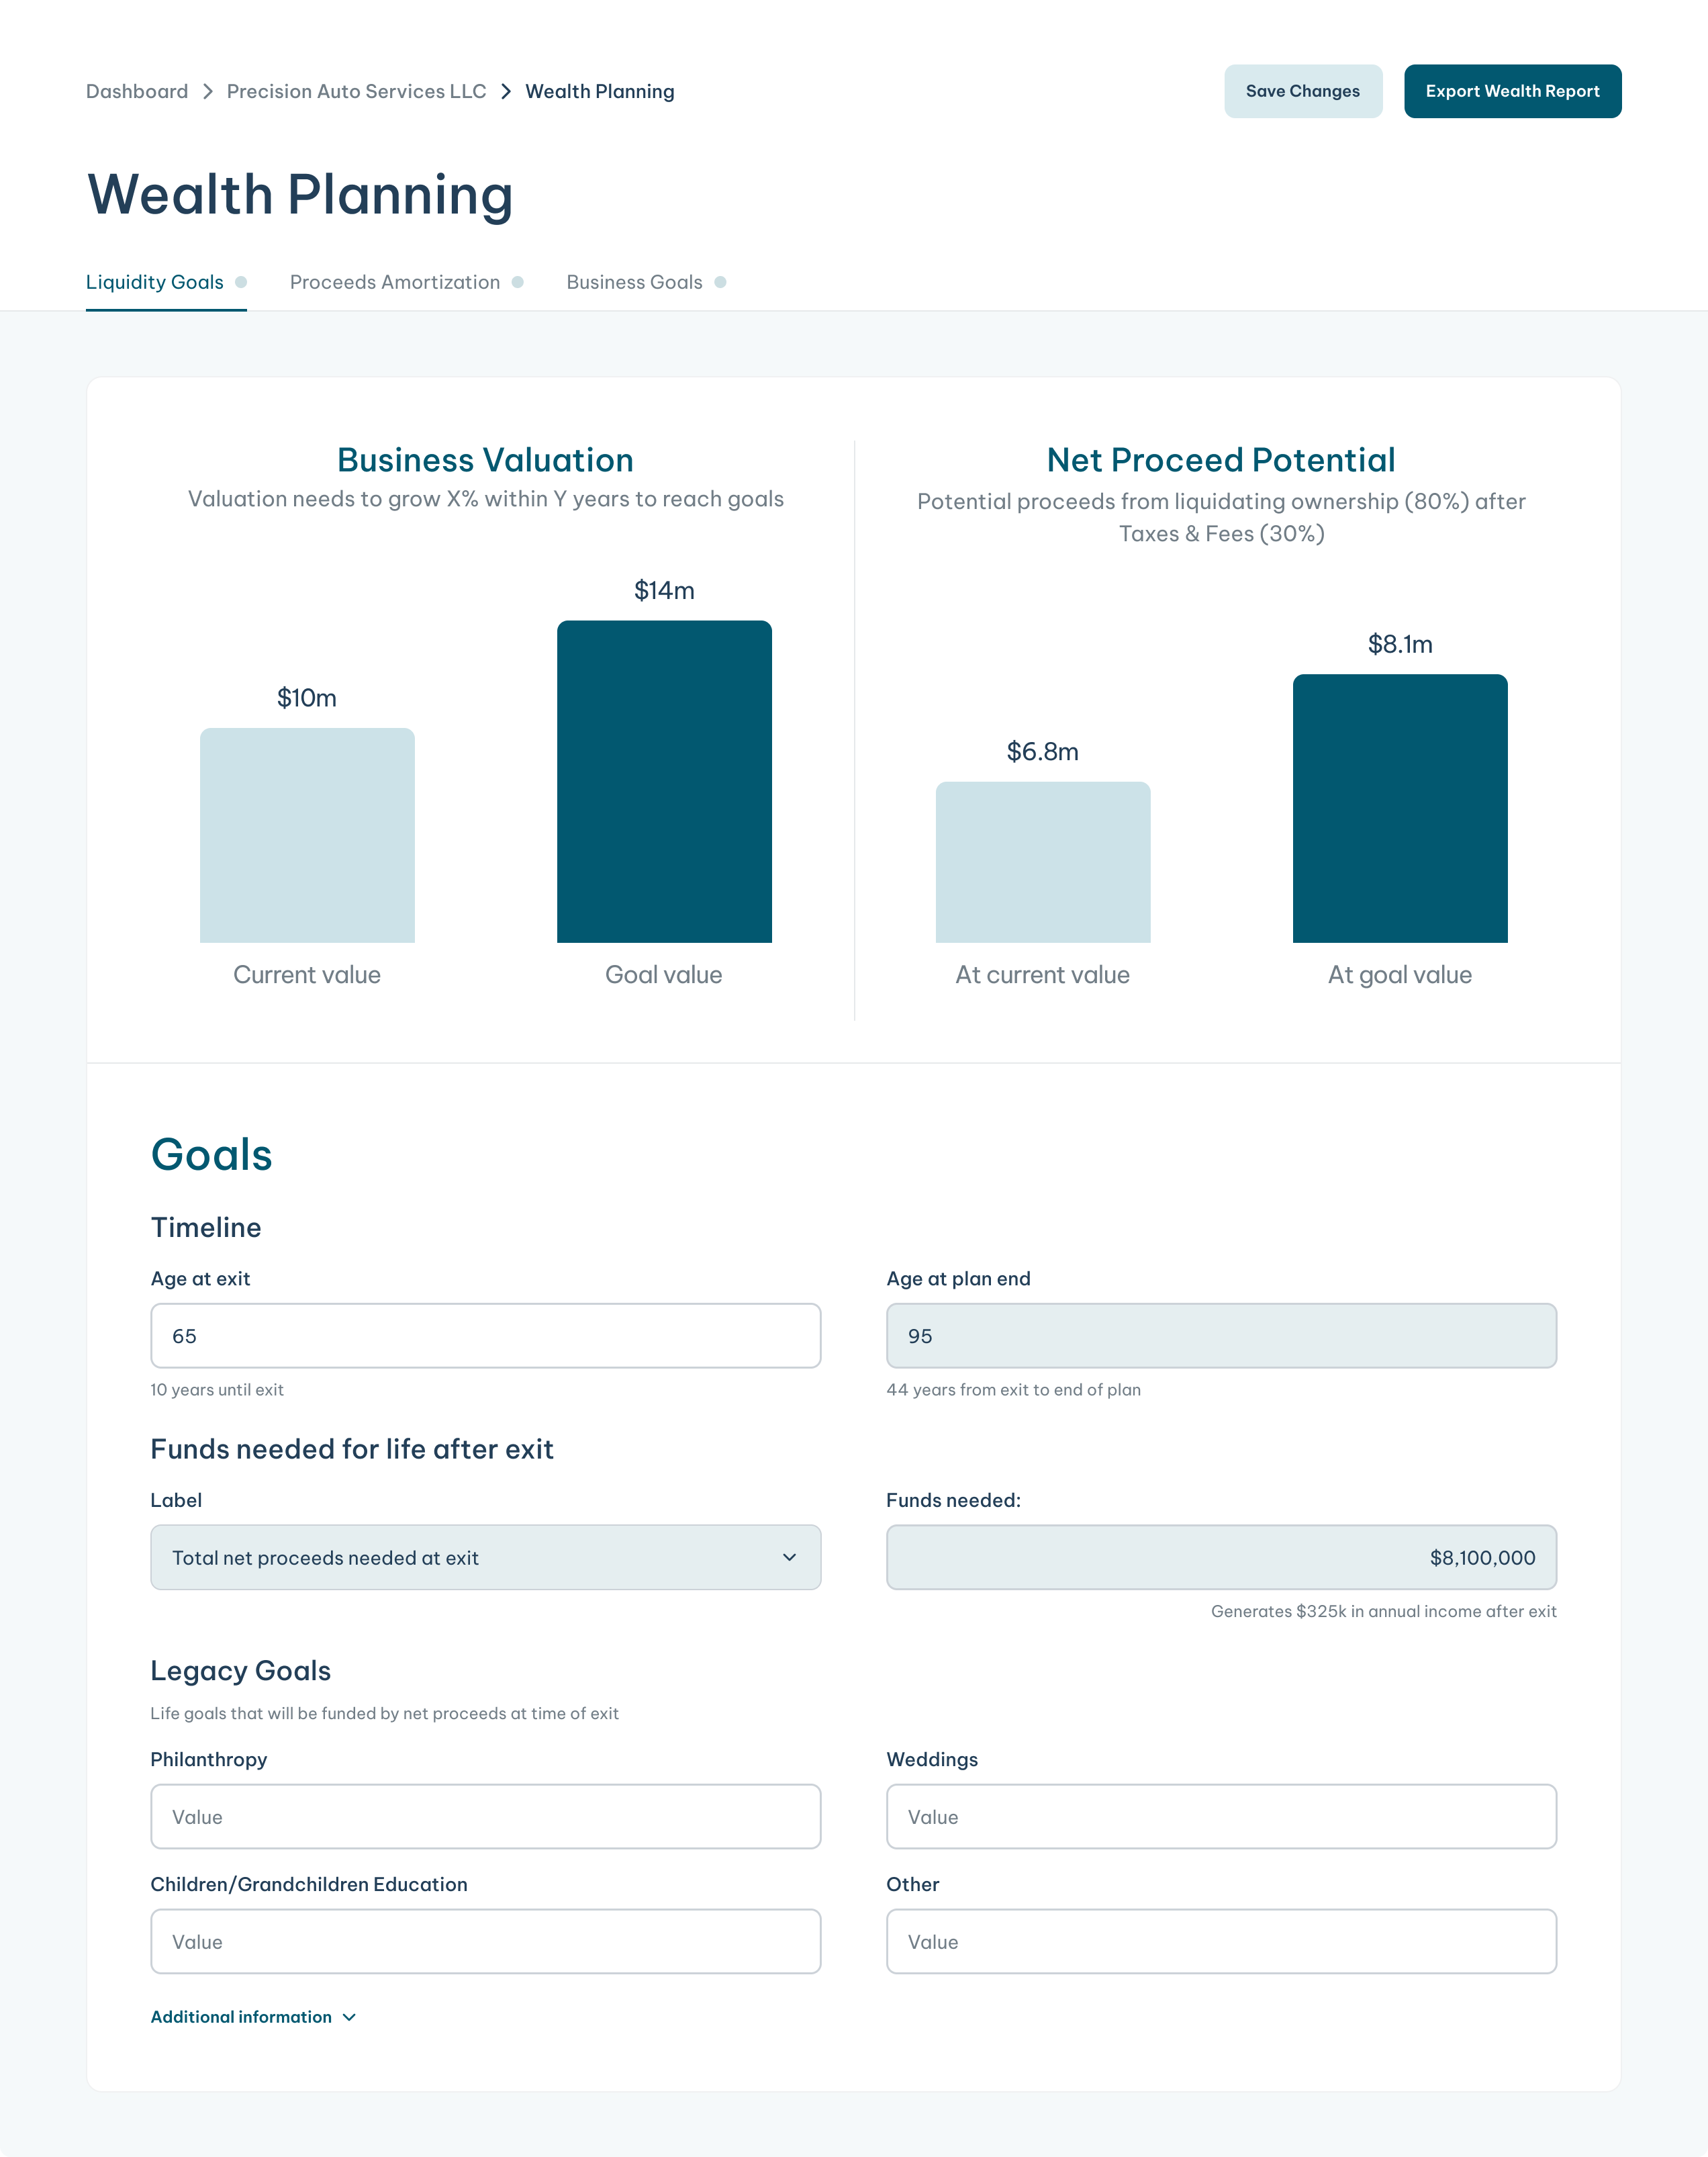
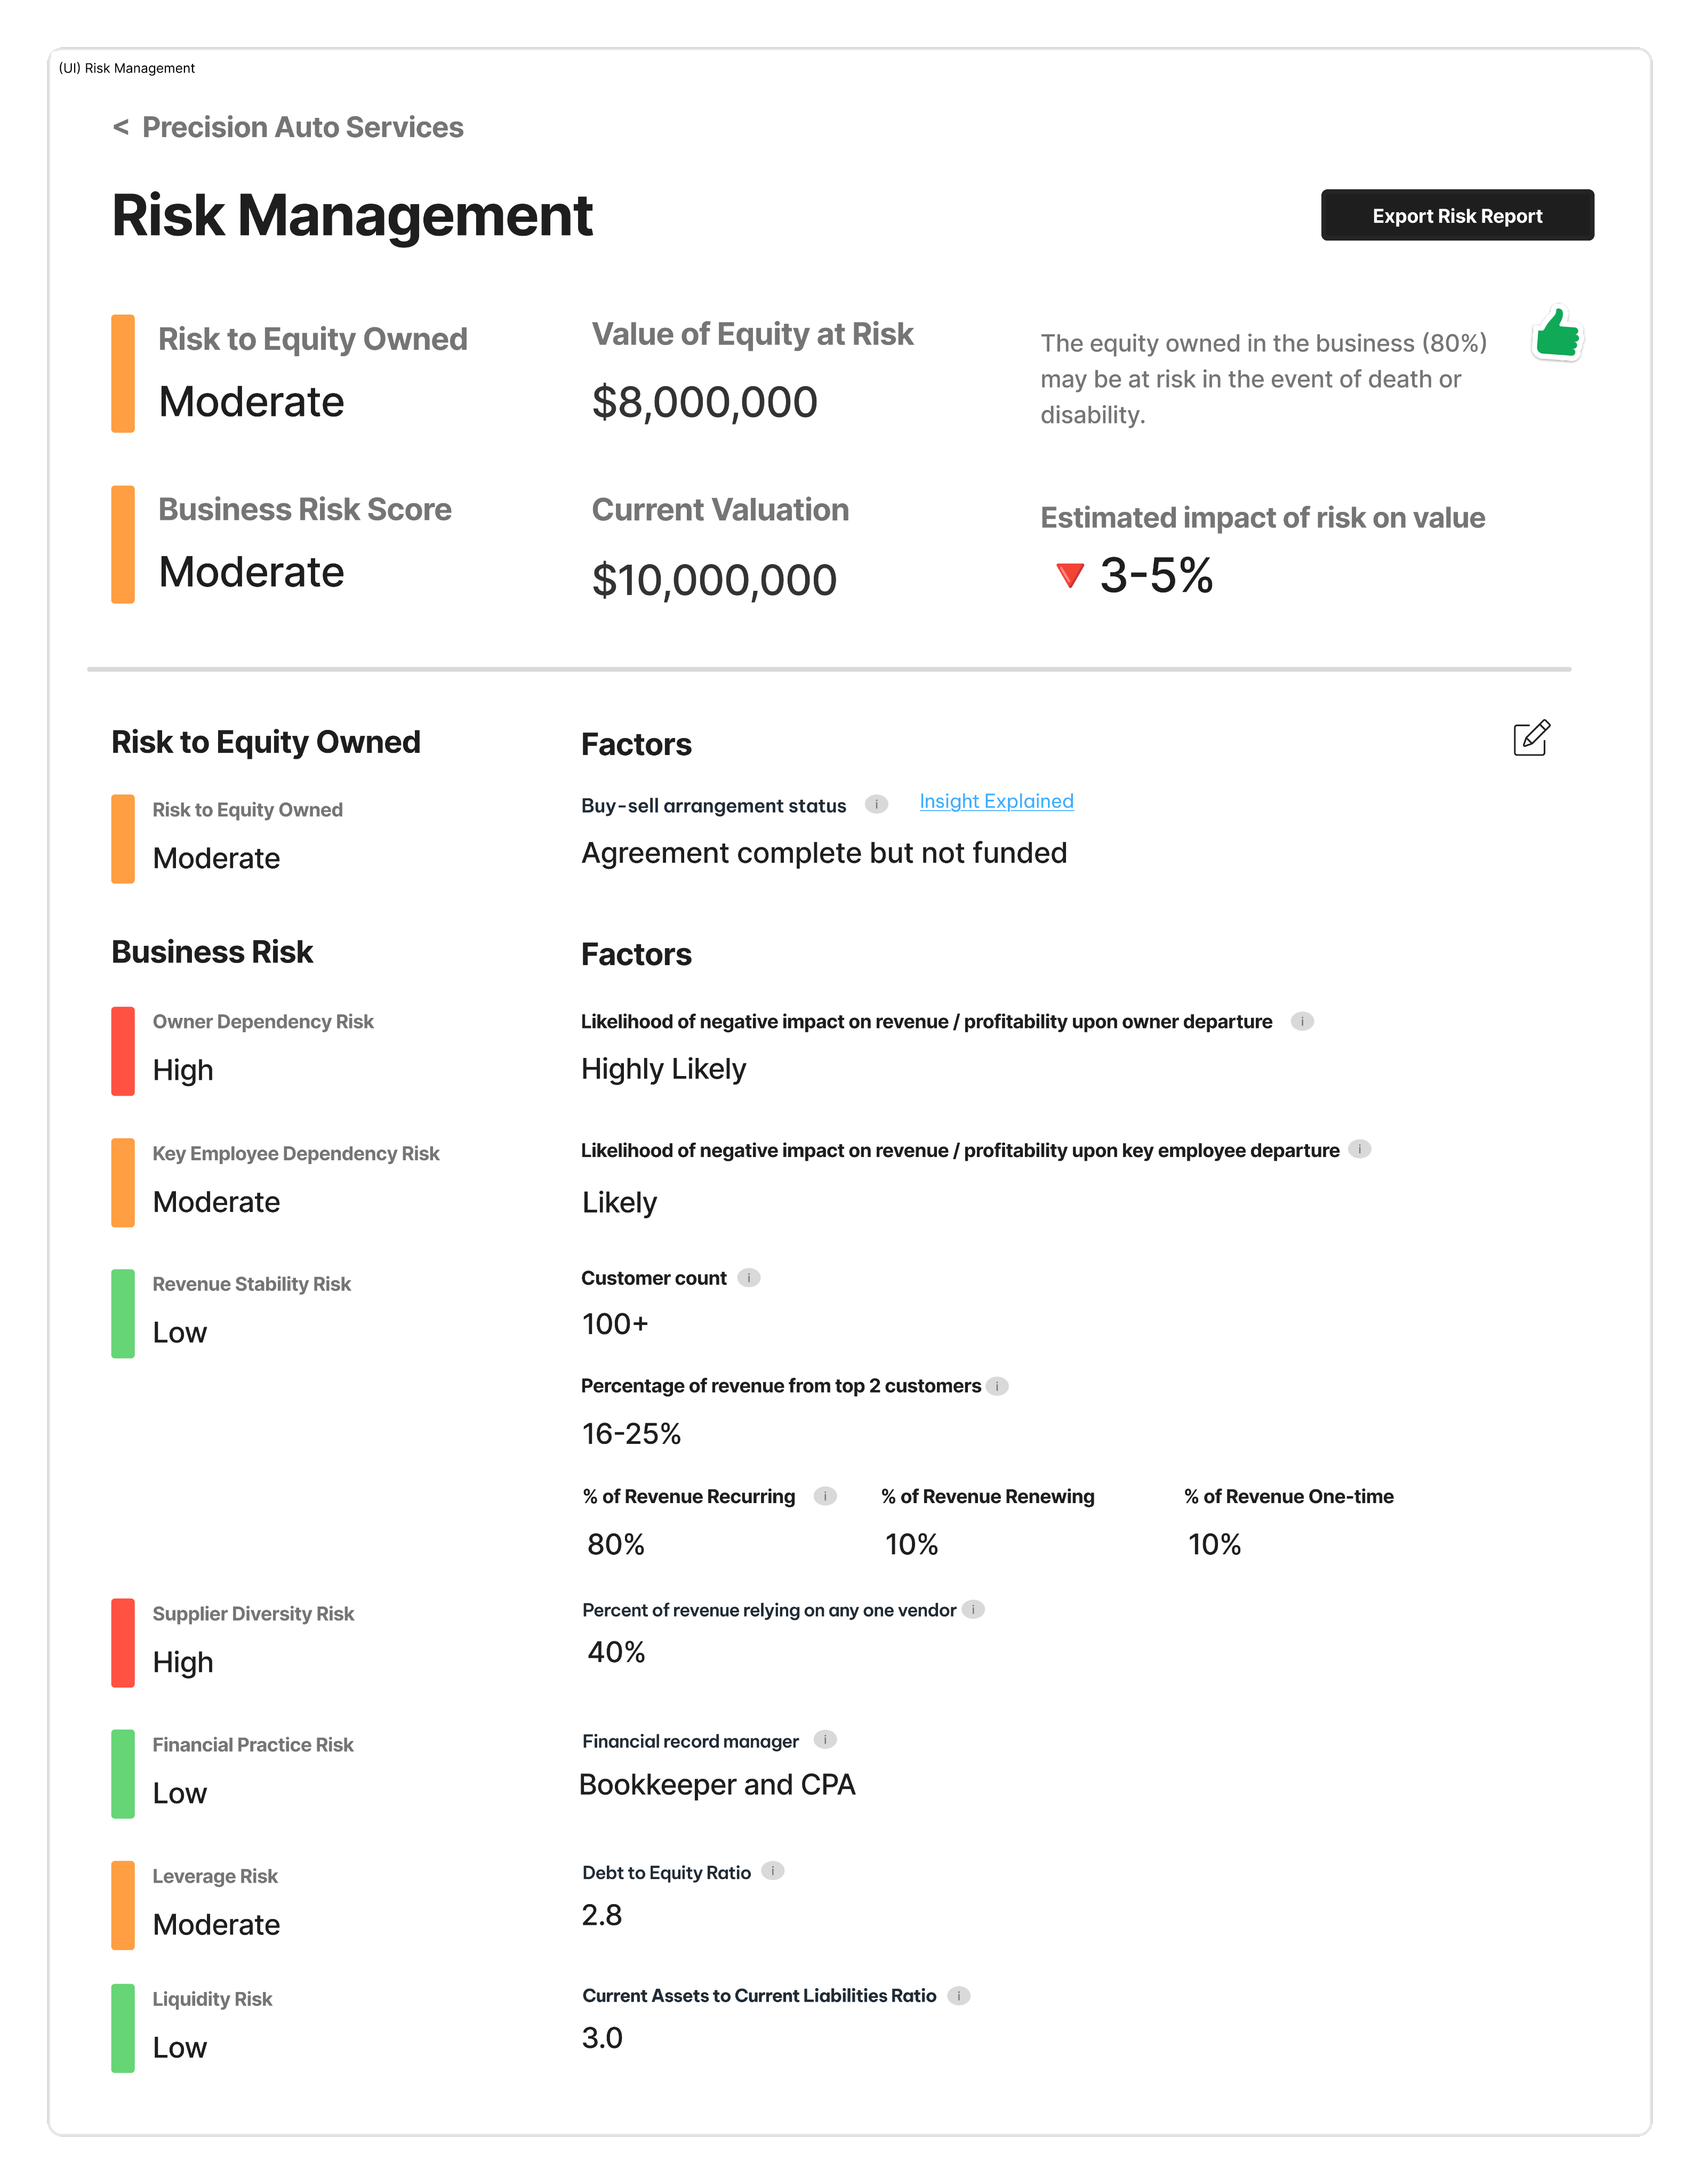
We kept components and information architecture consistent across service areas to reduce cognitive load when switching between them.
We used the blue accent background to create a “workspace” that primed advisors to see the content as a flexible canvas for insights, inputs, and assumptions.
Results & Impact
One advisor used insights from the platform to help their client secure a $500,000 higher exit price.
The Shift
Advisors stopped using RISR as a one-time closing tool and started bringing it into weekly client conversations. Instead of updating valuations once a year with tax documents, they generated talking points live during meetings, adjusting assumptions with clients and watching financial futures update in real time.
Advisors started using RISR weekly, generating live talking points and adjusting assumptions with clients in real time.
The bottom line
RISR stopped being a “nice to have” PDF generator. It became the system of record for how advisors think about their business owner clients.
RISR became the system of record for how advisors manage business owner clients.
$500k → $1m ARR
Doubled revenue to $1m ARR in 3 months post-launch
7x engagement
Advisors went from 1–2 touch points to 5–10 per year
1,000+ cases
Generated over 1,000 cases at a 95% completion rate
1st to market
First succession & exit planning tool in the market
Takeaways
RISR V1: Opinionated linearity
RISR V2: Contextual flexibility
Diagnose before you design
The most important decision in this project happened before any design work: diagnosing the right problem.
The data pointed to low case volume. The obvious fix was a better UI. But talking to advisors revealed a workflow fit problem. The product was designed around a moment (the close) instead of a practice (the ongoing relationship).
Fixing the surface without fixing the structure would have shipped a prettier version of the same failure.
Be precise about what you can't compromise on
The constraint story reinforced something I keep coming back to: protecting a vision doesn't mean refusing to change the implementation. It means being precise about what you actually can't compromise on.
We couldn't compromise on advisors feeling in control of a live conversation. We could compromise on how exactly that happened technically.
That precision is what let us ship on time without gutting the product.